NINTAI INVESTMENTS
  • About
  • Nintai Insights
  • Recommended Reading
  • Contact
  • Performance
  • Client Forms

Focusing on Fundamentals

1/30/2016

0 Comments

 
Yogi Berra once told the story of Whitey Ford’s performance in a game against the Chicago White Sox. Luis Aparicio – the Chicago lead off hitter – got on base with a single. Nellie Fox followed with another base hit. The third batter hit a towering home run. Casey Stengel – the renowned Yankees manager – trotted out to the mound with Berra following from home plate. “What do you think Yogi? Does Whitey have it today?” Stengel asked. “How the hell would I know? I haven’t caught one yet,” was Yogi’s classic reply [1].

One can hardly imagine Ford’s thoughts as he watched his third pitch of the game sail out of the ballpark. I think we can safely say it wasn't entirely positive. I bring this up because 2016 has started out much like Whitey’s Chicago performance. The Morningstar US Market Index is down 8.0% YTD, the S&P 500 TR is down 7.2% YTD and the MSCI EAFE is down 7.9% YTD (all figures as of Jan. 28).

Pressing: Or the Art of Making Hasty Decisions
For many investors, this has led to a tremendous amount of angst about their portfolios and their associated risk. In a great study [2] published in December 2014, Daniel Folkinshteyn (Rowan University), Gulser Meric (Rowan University), and Ilhan Meric (Rider University) analyzed investor performance during and after market crashes from 1987 to 2008. Similar to de Bondt’s and Thaler’s research in 1985 [3], stocks that saw price drops in a crash greater than the general markets tended to see higher gains than the general markets post crash. This overreaction is what many sports players know as “pressing,” or the problem of trying too hard after a period of poor performance. Investors were selling for too little and buying too high based on emotion alone.
The study showed that during market crashes, a vast majority of buying and selling had absolutely nothing to do with fundamentals. This form of financial “pressing” led to serious underperformance in the long run. Most of these individuals (and fund managers) would have been wiser to take the advice of many professional athletes, step back from the markets, and focus their energies on evaluating their process.

Focus On Fundamentals
As with athletes, investors can use down markets like today’s to take steps in improving their investment process. There’s no reason to panic – but rather take the time to sit down and really apply yourself to process improvement. These are three steps I highly recommend.

Go back and check your fundamentals
Whenever a particular holding in the Nintai Charitable Trust drops by a significant percentage, the first thing I do is head into my office, put on some Mozart and methodically review each and every part of our investment case. Sam Snead once said that every time he performed poorly on the golf course, he would step back and check his fundamentals. It’s no different in investing. Market dips are an outstanding time to step back and evaluate your process. At the same time, it's a great opportunity to test the fundamentals of your investment case. You can always improve from where you are today.

Watch what’s important….not what’s the loudest
In a world filled with enormous noise pollution, we sometimes fall prey to extremely bad advice proffered in ridiculously loud volumes. Much like Opus in Bloom County accosted by the Ronco ads on television, the noise machine that is Jim Cramer should not play a role in your investment decisions. Yogi Berra said about the noise and pressure from the crowd, “That didn't bother me. The only guy you watch is the guy pitching.” The only things worth watching is the assumptions, business case, and valuation of your holdings. Anything else is just noise.

Invert the trend driving the market
During down markets it’s helpful to identify the trend driving them and invert the thinking. For instance, price increases drove the outperformance of many biopharma companies over the past several years. The recent crash in prices assumes these increases will end through federal legislative and policy actions. But what if they didn’t? What if Medicare and Medicaid never negotiated on price? What if pharmacy benefit managers (PBMs) could never gain leverage in pricing as it is assumed will happen over the next decade? Will the drop in share prices rebound? Who will be the winner? Down markets are a great time to invert the market’s emotional assumptions.

Conclusions
The ability to shut out the noise around you and focus on fundamentals is imperative in markets like those in the beginning of this year. Turn off your TVs, put on some great thinking music, and roll up your sleeves. Even if the markets have dropped significantly, it's critical to make sure your assumptions and valuation are current and realistic. In most cases the fundamentals have nothing in common with the overreaction of the markets. Whitey Ford ended up winning that game in Chicago. Buckling down, he retired 13 of the next 14 batters without a run being scored. By focusing on his fundamentals (“I didn’t have my best stuff, so I focused on getting the ball over the plate”) he turned a rather dire situation around into a winning performance. Give it a try. If it worked for Whitey, it might just work for you as well.
​
[1] This story is part of a wonderful interview that can be found here. I highly recommend checking it out.
[2] The full study can be found here.
[3] This was discussed in greater detail in an article I wrote in July 2015 entitled “The Overreaction Hypothesis”. It can be found here.
0 Comments

the 2016 Nintai charitable trust portfolio: annual review

1/23/2016

0 Comments

 
It’s that time of the year when we open the proverbial kimono and disclose the holdings of the Nintai Charitable Trust. Each year we review the portfolio, take a look at key valuation measures, and discuss each holding in some detail. As usual the following disclaimers are in effect for our readers:
  1. The list consists of the current holdings of the Nintai Charitable Trust as of Jan. 1. Changes may be made in the portfolio without notification to the public at any time.
  2. Information in this article, including forecast financial information, should not be considered as advice or a recommendation to investors or potential investors in relation to holding, purchasing or selling securities or other financial products or instruments and does not take into account your particular investment objectives.
  3. Past performance is not a reliable indication of future performance.
  4. The description of each holding is my opinion as Chief Investment Officer of the Nintai Charitable Trust. In no way does it reflect the views of either GuruFocus or Dorfman Value Investments.
The Portfolio
After a year of heavy turnover, we find ourselves quite pleased with the 22 companies we currently hold in the Nintai Charitable Trust portfolio. We simply couldn’t be more happy partnering with Jeff Musser at Expeditors, Lothar Maier at Linear, or Ken Dedeluk at Computer Modelling Group along with our other investment partners.
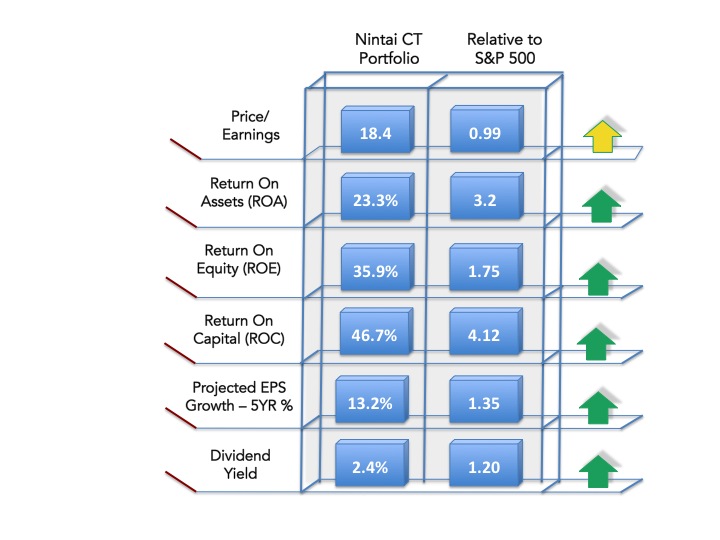
In general we like to maintain a portfolio that has a PE ratio equal or less than the S&P 500. In addition we look to have return on assets, return on equity, and return on capital be significantly higher than the general markets. Finally we look to have projected five-year earnings growth as well as the dividend yield be at least 20% above the S&P 500. Finding companies that can assist the portfolio in meeting these objectives is not easy. We have roughly 125 companies on our watch list that can do this. When we invest in one of these, we have a tendency to own it for an extended period of time.
​
As seen in the Nintai Abacus report below the portfolio currently meets our investment criteria.
Picture
Portfolio holdings
The portfolio currently consists of 22 companies. Each is led by a shareholder-friendly management team, achieves extraordinary returns on assets, equity, and capital, carries no short or long term debt (with several exceptions), and converts a high amount of revenue into free cash. The following are holdings in the Nintai Charitable Trust as of Jan. 1.
1. F5 Networks (FFIV)
F5 Networks is a developer and provider of software-defined application services designed to ensure that applications delivered over Internet Protocol (IP) networks are available to any user, anywhere, anytime, on any device and on any network. F5’s products embed themselves deeply into their customer’s technology infrastructure making a transition to a new vendor a difficult decision. FFIV has established itself as a leader in the mature Application Delivery Controller, or ADC, field, with 50% market share and considerable brand strength. We think the UMT market will grow at single higher digits over the next decade.
FFIV has generated an average ROE of 23%, FCF/Revenue of 32%, and net margins of 19% over the past five years. Management has generated a return on capital of 37% over the same period. The company currently has $400 million in cash on the balance sheet with no short or long-term debt. FFIV generates roughly $620 million in cash annually.
2. MasterCard (NYSE:MA)
MasterCard runs one of the duopoly-based closed network credit and debit card networks. They allow consumers, financial institutions, merchants, governments and businesses to use electronic forms of payment instead of cash and checks. MasterCard (along with fellow holding Visa) has one of the deepest moats in our portfolio. Their network functions as a tollbooth on financial transactions, generating a small amount of revenue from every transaction that runs through its network, and every dollar of payments made using the MasterCard brand.
MasterCard has generated an average ROE of 43%, FCF/Revenue of 36%, and net margins of 35% over the past five years. Management has generated a return on capital of 62% over the same period. The company currently has $4.3 billion in cash on the balance sheet with $1.5 billion of long-term debt. MasterCard generates roughly $3.4 billion in cash annually and yields 0.6%.
3. Fastenal (FAST)
Fastenal is engaged in the wholesale distribution of industrial and construction supplies in North America. The company offers bolts, nuts, screws, studs, and related washers; and miscellaneous supplies and hardware. Fastenal is a leader in the highly fragmented market of industrial distribution. With only $3 billion of the $140 billion maintenance and repair market, we believe there is a very long runway for growth. The company is known throughout the industry for its selection, customer service, and timeliness.
Fastenal has generated an average ROE of 26%, FCF/Revenue of 7%, and net margins of 13% over the past five years. Management has generated a return on capital of 26% over the same period. The company currently has $121 million in cash on the balance sheet with $125 million of short-term debt and no long-term debt. Fastenal generates roughly $336 million in cash annually and yields 2.6%.
4. T. Rowe Price (NASDAQ:TROW)
T. Rowe Price Group is a financial services holding company. It provides investment advisory services to individual and institutional investors in the sponsored T. Rowe Price mutual funds and other investment portfolios. With around 57% of its AUM held in retirement accounts and variable-annuity investment portfolios, the firm has a far stickier set of assets than its peers, and benefits from a nearly constant flow of capital into these funds. T Rowe Price has some of the best governance in the investment management space.
TROW has generated an average ROE of 23%, FCF/Revenue of 29%, and net margins of 29% over the past five years. Management has generated a return on capital of 23% over the same period. The company currently has $1.8 billion in cash on the balance sheet with no short or long-term debt. TROW generates roughly $1.2 billion in cash annually and yields 2.3%.
5. Computer Modelling Group (CMDXF)
Computer Modelling Group is a computer software technology company engaged in the development and licensing of reservoir simulation software. The stock dropped by nearly 40% with the crash of oil prices. With a large group of PhDs along with its patented technology, CMDXF would be hard to recreate in today’s world.
CMDXF has grown free cash flow and revenue at an average 26% and 18% over the past 10 years. CMDXF has generated an average ROE of 52%, FCF/Revenue of 39%, and net margins of 35% over the past five years. Management has generated a return on capital of 228% over the same period. The company currently has $55 million in cash on the balance sheet with no short or long-term debt. CMDXF generates roughly $30 million in cash annually and yields 4.0%.
6. CBOE Holdings (CBOE)
CBOE Holdings is engaged in trading of listed or exchange-traded, derivatives contracts on four categories; index options, futures on VIX, options on the stocks of individual equity, on the other exchange-traded funds and exchange traded notes. We have traditionally loved the business model of exchanges – deep competitive moats, high returns, and steady growth. CBOE is one of the best with a near monopoly on the derivatives market and a management team focused on shareholder return.
CBOE has generated an average ROE of 69%, FCF/Revenue of 32%, and net margins of 28% over the past five years. Management has generated a return on capital of 71% over the same period. The company currently has $122 million in cash on the balance sheet with no short or long-term debt. CBOE generates roughly $235 million in cash annually and yields 1.2%.
7. Terra Nitrogen (NYSE:TNH)
Terra Nitrogen produces and distributes nitrogen fertilizer products. Its products include anhydrous ammonia and urea ammonium nitrate solutions. TNH is a wonderful little business producing a product of increasing need – fertilizer. We believe the company will do great over the long term as countries around the world seek to make their land yield increasing crops per acreage.
TNH has generated an average ROE of 116%, FCF/Revenue of 55%, and net margins of 41% over the past five years. Management has generated a return on capital of 71% over the same period. The company currently has $113 million in cash on the balance sheet with no short or long-term debt. TNH generates roughly $338 million in cash annually and yields 7.2%.
8. Intuitive Surgical (NASDAQ:ISRG)
Intuitive Surgical designs, manufactures and markets da Vinci Surgical Systems and related instruments and accessories. A da Vinci Surgical System consists of a surgeon's console, a patient-side cart, and a high performance vision system. Da Vinci Surgery utilizes computational, robotic and imaging technologies to enable improves patient outcomes compared to other surgical and non-surgical therapies. As new therapeutic areas begin to utilize robotic technology, ISRG should see continued growth.
ISRG has generated an average ROE of 19%, FCF/Revenue of 31%, and net margins of 27% over the past five years. Management has generated a return on capital of 63% over the same period. The company currently has $1.8 billion in cash on the balance sheet with no short or long-term debt. ISRG generates roughly $506 million in cash annually and does not pay a dividend.
9. Singapore Exchange Ltd. ADR (SPXCY)
Singapore Exchange is a full-service exchange operating trading platforms and clearing houses for both securities and derivative products. The company's business segments are Securities Market, Derivatives Market, and other operations. Singapore Exchange is a magnificent little business that churns out enormous amounts of cash and generously shares it with its co-owners. We believe there is a strong possibility of future roll up in this market though we’d hate to see this gem slip away.
SPXCY has generated an average ROE of 36%, FCF/Revenue of 46%, and net margins of 46% over the past five years. Management has generated a return on capital of 43% over the same period. The company currently has $623 million in cash on the balance sheet with no short or long-term debt. SPXCY generates roughly $254 million in cash annually and yields 3.9%.
10. Collectors Universe (CLCT)
Collectors Universe provides authentication and grading services to dealers and collectors of high-value coins, trading cards, event tickets, autographs and memorabilia. We are always seeking situations where two or three companies dominate a market. Collectors is part of a duopoly (along with NGC) that dominates the grading of collectables such as coins and baseball cards. A company that needs almost no capital and generates enormous cash flow, management is focused on wise allocation of capital (or in the absence of that, return of capital).
Collectors has generated an average ROE of 29%, FCF/Revenue of 18%, and net margins of 12% over the past five years. Management has generated a return on capital of 31% over the same period. The company currently has $15 million in cash on the balance sheet with no short or long-term debt. Collectors generates roughly $8 million in cash annually and yields 9.0%.
11. Linear Technology (LLTC)
Linear Technology is engaged in designing, manufacturing and marketing line of high performance analog integrated circuits for companies in diversified industries. Linear’s focus on HPA chips allows it to generate returns unlike any other chip maker. As the clear leader in the space, the company has carved out a very wide moat that we see continuing for the next decade or two.
Linear has generated an average ROE of 80%, FCF/Revenue of 40%, and net margins of 34% over the past five years. Management has generated a return on capital of 63% over the same period. The company currently has $217 million in cash on the balance sheet with no short or long-term debt. Linear generates roughly $593 million in cash annually and yields 2.7%.
12. Novo Nordisk (NYSE:NVO)
Novo-Nordisk is a healthcare company that is engaged in the discovery, development, manufacturing and marketing of pharmaceutical products. The company has two business segments: diabetes care and biopharmaceuticals. As the preeminent leader in diabetes, the company has captured roughly one-quarter of the market and has opportunities to sustain steady growth for the next decade. The company has consistently focused on returns and ignored the M&A craze maintaining a rock solid balance sheet.
NVO has generated an average ROE of 53%, FCF/Revenue of 27%, and net margins of 27% over the past five years. Management has generated a return on capital of 58% over the same period. The company currently has $2.2 billion in cash on the balance sheet with no short or long-term debt. NVO generates roughly $4.4 billion in cash annually and yields 1.3%.
13. Expeditors International (NASDAQ:EXPD)
Expeditors International is the most profitable among the top 10 global freight forwarders in a fragmented industry. It currently has operations around the world but has its strongest presence in the Asia-North America trade lanes. The company operates in an asset light business model producing high returns on capital. We think the company has one of the most shareholder friendly managements in the portfolio.
EXPD has generated an average ROE of 19%, FCF/Revenue of 6%, and net margins of 6% over the past five years. Management has generated a return on capital of 32% over the same period. The company currently has $970 million in cash on the balance sheet with no short or long-term debt. EXPD generates roughly $500 million in cash annually and yields 1.4%.
14. ARM Holdings (NASDAQ:ARMH)
ARM Holdings PLC designs microprocessors, physical IP and related technology and software, and sells development tools to enhance the performance and energy-efficiency of high-volume embedded applications. ARM’s technology and patents are at the heart of processers used in nearly every mobile device. Its IP is assured through an interlocking set of patents that assure a competitive moat for an extended period of time. We think the worldwide growth of mobile devices and interconnectivity provides the company with a very long runway for profitable growth.
ARM has generated an average ROE of 14%, FCF/Revenue of 36%, and net margins of 24% over the past five years. Management has generated a return on capital of 26% over the same period. The company currently has $113 million in cash on the balance sheet with no short or long-term debt. ARM generates roughly $500 million in cash annually and yields 0.9%.
15. Visa (NYSE:V)
Much like our sister holding MasterCard, Visa runs a duopoly-based closed network credit and debit card networks. They currently have roughly 50% of all credit card transactions and 75% of all debit card transactions. A wide moat indeed. We think the movement to credit based economies will provide Visa with a fantastic long-term growth story.
Visa has generated an average ROE of 16%, FCF/Revenue of 40%, and net margins of 38% over the past five years. Management has generated a return on capital of 42% over the same period. The company currently has $3.5 billion in cash on the balance sheet with no short or long-term debt. Visa generates roughly $6.2 billion in cash annually and yields 0.7%.
16. Check Point Software Technology (NASDAQ:CHKP)
Check Point has been known as the leader in unified threat management for the past 20 years. It has spent the last several years retooling its offerings to meet the SaaS model as well as new competitors. Its moat is considerable as it is extraordinarily difficult to swap out UTM security for a new vendor.
Check Point has generated an average ROE of 19%, FCF/Revenue of 59%, and net margins of 44% over the past five years. Management has generated a return on capital of 39% over the same period. The company currently has $258 million in cash on the balance sheet with no short or long-term debt. Check Point generates roughly $930 million in cash annually and does not pay a dividend.
17. Waters (WAT)
Waters provides instruments used across the healthcare and food industries. They are utilized from biopharma R&D to quality control in food labeling. The company has been slow moving into adjacent markets (such as food labeling) where their high-end systems are vital to corporate safety and regulatory efforts. Management has used laser-like focus to not overextend or make acquisitions outside their core competency.
Waters has generated an average ROE of 33%, FCF/Revenue of 21%, and net margins of 23% over the past five years. Management has generated a return on capital of 51% over the same period. The company currently has $460 million in cash on the balance sheet, $1.5 billion in long-term debt, and $175 million in short term debt. Waters generates roughly $462 million in cash annually and does not pay a dividend.
18. Paychex (PAYX)
In another duopoly, Paychex (along with ADP) provides outsourced payroll services. While this area has been relatively stagnant over the past five years, Paychex has created cross-selling models that include PEO services, retirement plans, and other HR services. We expect these to drive growth as well as the return of normalized interest rates that provide significant “float” revenue.
Paychex has generated an average ROE of 36%, FCF/Revenue of 28%, and net margins of 25% over the past five years. Management has generated a return on capital of 38% over the same period. The company currently has $412 million in cash on the balance sheet with no short or long-term debt. Paychex generates roughly $800 million in cash annually and yields 3.4%.
19. Ansys (ANSS)
Ansys is the only complete systems provider in the engineering simulation software market. The company is generally considered the gold standard in its field with engineers around the world utilizing its installed base. We think the company’s ability to continue to take market share (in a very fragmented market) as well the tailwind of overall adoption rates will provide the company with a long-term future of moderate growth.
ANSS has generated an average ROE of 16%, FCF/Revenue of 35%, and net margins of 27% over the past five years. Management has generated a return on capital of 28% over the same period. The company currently has $776 million in cash on the balance sheet with no short or long-term debt. ANSS generates roughly $335 million in cash annually and does not pay a dividend.
20. Computer Programs and Systems (NASDAQ:CPSI)
Computer Programs and Systems provides enterprise-wide systems in order to automate data management of both financial and clinical data. The company is focused on rural and smaller hospitals where it has a lead against some of the larger EMR providers (such as Epic). The company recently announced the acquisition of Heartland that provides CPSI with a considerable stake in the long-term care market and increases market share to roughly one-quarter of the community hospital market.
CPSI has generated an average ROE of 48%, FCF/Revenue of 14%, and net margins of 15% over the past five years. Management has generated a return on capital of 27% over the same period. The company currently has $28 million in cash on the balance sheet with no short or long-term debt (Note: this will change with the acquisition of Heartland). CPSI generates roughly $38 million in cash annually and yields 5.2%.
21. Dolby Laboratories (DLB)
Most people know Dolby through their noise reduction headsets or the ubiquitous logo at the bottom of every movie credit. The company provides technology for both consumer and commercial markets. We think Dolby has done a good job as it continues to make preparations for the loss of a considerable amount of patents in 2017. The high growth days are over but the continued growth in the middle class provides ample growth opportunities for the company.
Dolby has generated an average ROE of 14%, FCF/Revenue of 25%, and net margins of 24% over the past five years. Management has generated a return on capital of 23% over the same period. The company currently has $531 million in cash on the balance sheet with no short or long-term debt. DLB generates roughly $114 million in cash annually and yields 1.4%.
22. Morningstar (MORN)
Morningstar provides two product lines – investment information and investment management. The same data that powers Morningstar.com's large data set also feeds into sites like Yahoo Finance (YHOO) and MSN Money (MSFT). Morningstar's customers also include institutional money managers, broker-dealers, and other investment advisors. We think the management Morningstar has a deep competitive moat with its fund rating services and its historical database. We expect high single digit growth over the next decade.
Morningstar has generated an average ROE of 16%, FCF/Revenue of 18%, and net margins of 15% over the past five years. Management has generated a return on capital of 38% over the same period. The company currently has $223 million in cash on the balance sheet with no short or long-term debt. Morningstar generates roughly $188 million in cash annually and yields 1.0%.
Conclusions
The Nintai Charitable Trust begins the year with roughly one-half of the portfolio added since last year’s report. We continue hold a considerable amount of cash (nearly 10% of AUM) even after the market decreases since the beginning of the year. Overall the portfolio presents one of the most profitable and highest return selection of companies we’ve ever owned. Is it guaranteed to outperform the great markets over the next one, three or five years? We have no idea and can make no promises to do so. But if we allow our managers to continue to achieve high returns on capital and let compounding work its magic, we are confident it can achieve adequate (for the Trust’s needs) returns in the long term.
0 Comments

beating the crowd by changing your lens

1/18/2016

1 Comment

 
“Beating the crowd means thinking differently than the crowd. Our own internal thinking should provide us with a competitive advantage by being different and providing better insights. A question I will ask each of you is: how have you looked at a problem differently today? And what impact did that make on your decision making?”  - Arthur Haynes, Ph.D.
At the Nintai Charitable Trust we have a tendency to deviate from traditional value investing in the criteria we use searching for potential investments. We generally screen for extremely high quality companies ruling out the more traditional cigar butt or net/nets that Benjamin Graham made so famous. This doesn't mean one method is better than the other. We simply have better results – within our own behavioral constraints – utilizing our own system.

For many investors, the price-to-earnings ratio is critical to ascertaining value. For my compatriot John Dorfman, a PE of 10 or less is a hard criterion for selecting opportunities. At the Nintai Charitable Trust we rarely look at the PE when considering a stock. We utilize a much different number which we think gives us a number more relevant to our investment goals. This is cash return.
Cash return
Cash return is a metric rarely found these days in investment analysis. That’s a shame. Cash return allows us to quickly analyze two factors about an investment opportunity. First, the cash return metric measures how efficiently the business is using its capital – both equity and debt – to generate free cash flow. Second, it can tell us how the stock stacks up – valuewise – against a risk-free investment in U.S. Treasuries or slightly more risky high quality corporate bonds.
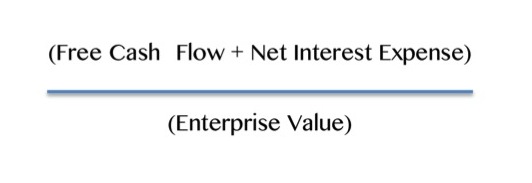
The formula for cash return is actually quite simple
Picture
You can calculate cash return by adding free cash flow (cash from operations minus capital expenditures) to net interest expense (interest expense minus interest income), then dividing the sum by enterprise value (market cap plus long-term debt minus cash). You add back interest expense to free cash flow so capital structure doesn't impact cash return.
We like cash return as a first step in ascertaining the long-term valuation of the company in the context of the equity risk premium.
A working example
I’ll use F5 Networks (NASDAQ:FFIV), a current Nintai Charitable Trust holding, as an example. In January 2016 the company had a market cap of $6.4 billion, had no long-term debt and had $774 million in cash on the balance sheet. Its enterprise value is $5.7 billion ($6.4 billion + $0 – $774 million). For the denominator F5 Networks generated $617 million in adjusted free cash flow. Thus the cash return for the company is 11% ($617 million/$5.7 billion).
With 10-year Treasuries yielding just 2.3% and corporate bonds yielding a higher (but still pretty low) 3.2% in January 2016, the 11% cash return for F5 Networks is more than adequate. Given the fact that F5’s free cash flow has grown at an average 24.7% annually over the past 10 years and 16.5% over the past five years and bond payments are fixed, F5 Networks starts to look interesting.
When looking at F5, many value investors might pass immediately when seeing a P/E of 19. Certainly those who more rigorously apply Benjamin Graham’s low P/E strategy would likely reject it. But we think cash return tells us a different story. Measured against a risk-free (or should we say “relatively risk free” these days!) investment in U.S. Treasuries, F5 compensates its higher risk with a much higher reward. Looked at in this manner, the company might be perceived as a more “value-based” investment than others would say. Does the cash return make F5 a strong investment opportunity? That we can’t say. Only by utilizing far more detailed discounted cash flow models, market analyses, operational evaluation and competitive reviews can we make a more informed decision. But it certainly gives a different perspective than a PE ratio.
Conclusions
Utilizing cash return rather than the PE ratio isn’t better; it’s simply different. It has both its advantages and disadvantages in comparison. What makes it interesting is the fact that looking at potential investments through different lenses can provide us with unique insights that other investors may not see. As Haynes so succinctly put it, thinking differently is required to beat the crowd. By utilizing some less well-known measurement criteria, you can both analyze differently and achieve different insights than the crowd. Ultimately this allows you to either outperform or underperform the general markets, but you will know your returns are uniquely your own.
1 Comment

outsourcing snowballs: MANAGEMENT AND COMPOUNDING VALUE

1/9/2016

0 Comments

 
When I was kid in elementary school, nothing got me more excited than a snowball fight. One of the first things that occurred to me was having more snowballs than my opponent was a powerful advantage. One day, I somehow I got my neighbor to make snowballs behind me as I threw them. It seemed like I had a snowball machine gun and my enemies were routed. It was a lesson I kept for the rest of my life – let someone else build your snowballs.”
                                                                                                     - Ron Hart

One of the goals of any value investor is finding that Shangri-La known as the 10-bagger or more formally known as decupling your investment. This idea of seeing your investments snowball was the title of the most recent Warren Buffett (Trades, Portfolio) biography. At the Nintai Charitable Trust, we are as eager as any other investor to invest in a 10-bagger. Sloth and indolence, however, are two predominant features of our corporate culture. In our investment process, we recognize we simply aren’t smart enough to time markets. Correspondingly, we rarely like to do the heavy lifting to grow a business (we’ve already done that) and now look for management teams who know how to compound value.

In essence, we outsource our snowballs. It sounds easy, but interestingly there simply aren’t that many management teams that year after year create value for shareholders. Inevitably, management seems to develop some form of clinical psychosis and begin believing in their omnipotence and guru status. Engaging in empire building, these individuals will begin to cast about for acquisitions – that for no better way to describe – destroy shareholder value. These events usually happen when you least expect it – during long summer vacations or winter holidays where you have limited communication access. Rather than a snowball, you end up with a large puddle of water. To avoid these all too common results, when looking at a potential investment at the Nintai Charitable Trust, we utilize a measure of returns that management achieve with retained capital.

Return on allocated capital

Nothing tells us more about the financial stewardship of corporate management than how they allocate capital. One of the measures we use on any potential investment is the return management achieves on retained capital. This formula is simply taking the increase in earnings from Year 1 to Year 5 and dividing by the sum of all five years earnings less any dividends paid out to investors. The formula would look like this:

(Increase in earnings Year 1 – Year 5)

(Sum of five-year earnings) – (Dividends paid out)

This formula gives the return on allocated capital achieved by management over the past five years. At the Nintai Charitable Trust, we look for management teams that have achieved at least 20%+ over that period of time. As we’ve previously stated, there simply aren’t that many corporate managements that achieve such results. We currently have a list of roughly 125 companies that meet such criteria and are constantly on the lookout for new additions to the list.

A Working Example

An example of such a company is CBOE Holdings (NASDAQ:CBOE), a current holding of the Nintai Charitable Trust. CBOE Holdings is engaged in trading of listed or exchange-traded, derivatives contracts on four categories: index options, futures on VIX, options on the stocks of individual equity, on the other exchange-traded funds and exchange traded notes. We have traditionally loved the business model of exchanges – deep competitive moats, high returns, and steady growth. CBOE is one of the best with a near monopoly on the derivatives market and a management team focused on shareholder return. CBOE has generated an average ROE of 69%, FCF/Revenue of 32%, and net margins of 28% over the past five years. The company currently has $122 million in cash on the balance sheet with no short or long-term debt. CBOE generates roughly $235 million in cash annually and yields 1.2%.

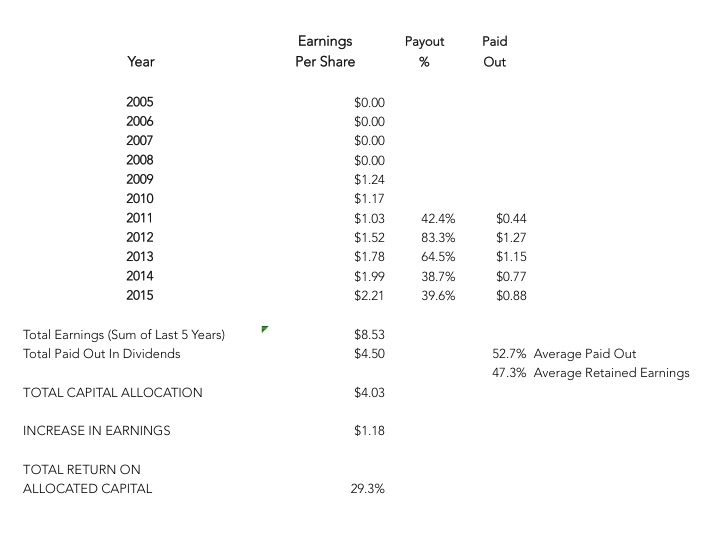
Calculating management’s return on allocated capital, we start in the year 2011 when the company had earnings of $1.03 per share (see calculations below). By 2015 earnings had increased to $2.21 per share. For the five-year period, the company had increased earnings by $1.18 per share. During that same period, the company had a total of $8.53 per share in earnings of which 53% was paid out in dividends. This means that management retained $4.03 per share of earnings that they allocated towards the business. By dividing the total earnings allocated by the increase in earnings, we can see that management achieved a 29% return on allocated capital. We think this is an impressive performance over the measured time frame.
Picture
Conclusions
Achieving high returns on allocated capital doesn't assure us the company is a great investment opportunity. It does allow us to rule out management teams that – over time – simply don’t compound value for investors. By combining this measure with other factors such as valuation, intrinsic value, balance sheet strength, returns on equity/assets, and others, we can begin to develop a portrait of management who wisely allocate capital. As we mentioned earlier, why not let your investment’s managers do the heavy lifting for your portfolio? By outsourcing your snowball building, you can focus on the more important aspects of life – like getting into an actual snowball fight with your kids.
As always, I look forward to your thoughts and comments.
​
0 Comments

a devil of a year: 2015 in review

1/5/2016

1 Comment

 
This was quite a year from both a personal and professional perspective. The biggest change was the dissolution of Nintai Partners and the creation of the Nintai Charitable Trust.
Having fought cancer for five years, I simply don’t have the energy to be on the road 250 days of the year traveling to see clients and answering phone calls at all hours of the night. Also, I have focused on my passion for value investing. Working with the Charitable Trust as well as consulting with Dorfman Value Investments has been a pure joy. I simply couldn’t work with more pleasant and knowledgeable people.
​
On a personal note, I tried rock climbing for the first time and – after several stunning demonstrations of ineptitude – began to see a connection with investing. Putting aside the all-too-easy similarities of plunging falls, bruised egos and soaring heights, I learned there are several major rules that apply to both.

Don’t hug the wall: As counterintuitive as this may seem, the more unsure of yourself you are the farther you should be from the wall. As fear naturally takes hold, I found myself pinned against the rock. This took away any vision I had limiting my options. Investing is no different. By focusing too much on details, sometimes it’s impossible to get a good picture of what steps to take next. As fear builds, it is critical that as an investor you lean out and get a clear vision of the terrain.
Don’t rush others or yourself: It’s considered impolitic to rush others on the wall. By forcing others to move before they are confident or ready, we can create errors. I learned the same goes for me. Every time I made a move where I felt time constraints, I usually made a mistake. In investing, time is your ally not your enemy. Unforced errors – made with the ticking clock in mind – usually mean investing outside your selection criteria.
More eyes mean better routes: I was fascinated by the more successful climbers and how they discussed potential routes. They were remarkably open about their thoughts, suggestions and questions. They never considered it an option to hold their information and focus on their own sight. I think investing is similar. Sharing thoughts with other investors or writers on GuruFocus makes me a better investor.
Be prepared to help others: One thing I learned climbing was that everyone is linked together – literally and figuratively. You don’t get extra points by racing ahead of everyone else, and you sure as hell need to be thinking about your climbing partners. We think investing is quite similar. We are tethered to the success or failure of our investment partners. Our research is only as good as the team that produces it. Finally, we think it's of huge value to share our learnings and lend a hand when it's needed.

The year in review: Why do we do this?

At the beginning of each year, we take a look back and see how the portfolio performed over the past 12 months and also see how we are doing over the long term. Each year we include three questions that both we as management and you as investors should look to answer.
1. Does our philosophy and process work?
There really isn't any better way to analyze whether our investment process works than measuring our returns against our proxies. It's our goal to significantly outperform the markets in the long term. To prove that, we need to demonstrate an ability to beat our benchmark and explain why we have or haven't done so in the short and long term.
2. Is it worth it for our investors to remain invested with us?
Every day we go to work knowing it is extraordinarily difficult to beat a low-cost index fund over time. To make it worthwhile for our investors we need to both outperform the indices and do it in a way that our investors can sleep well at night. If we meet these conditions we are confident our investors will remain long-term partners on our journey.
3. How do we improve our process and returns?
No investment process we've designed – or seen – has been perfect for its entire lifetime. We like to use our annual reports to discuss what we've learned and what steps we are taking to improve our professional knowledge as well as investment process.

2015 review
2015 was certainly a year to remember. The Nintai Charitable Trust had its highest turnover since the 2008 market crash. Total turnover was 91% with the Trust exiting eight positions and taking profits in an additional four stocks. Additionally, we took initial positions in 11 new companies. In essence we almost turned over the entire portfolio during the calendar year.
Starting with our exits, FactSet Research (NYSE:FDS) and Manhattan Associates(NASDAQ:MANH) were sold based on valuation. These were long-term holdings (both were purchased in 2006) that we would have preferred to hold, but the markets had priced beyond perfection. Additionally we sold out of our positions in Hermés (HESAY), Coach (COH) and New Oriental (EDU) based on reductions in both competitive moats and valuation reductions. Baxter(BAX) was sold after the announcement of the break up of the company. We exited Blackrock (BLK) based on our assessment on the financial industry and the fact we already own T Rowe Price (TROW). We also took profits with Synaptics (SYNA) but still hold a considerable position.

We welcomed a host of new companies to the portfolio in 2015. The mini-crash of the summer allowed us to purchase positions in two truly outstanding companies – Paychex (PAYX) and Linear Technology (NASDAQ:LLTC). A swoon in price allowed us to welcome back Intuitive Surgical(ISRG). During the course of the year, dramatic mispricing relative to value allowed us to purchase CBOE Holdings (NASDAQ:CBOE), Computer Programs and Services (NASDAQ:CPSI), Computer Modelling Group (CMDXF) and Collectors Universe (NASDAQ:CLCT). We expect each of these to be long-term holdings in the Charitable Trust portfolio. We added F5 Networks(FFIV) and SolarWinds (NYSE:SWI) after the companies had disappointing quarters, and we felt the shares were significantly undervalued. Late last year it was announced Silver Lake Partners and Thomas Bravo would acquire SolarWinds. We expect to net a roughly 90% annualized return when the transaction closes in March.

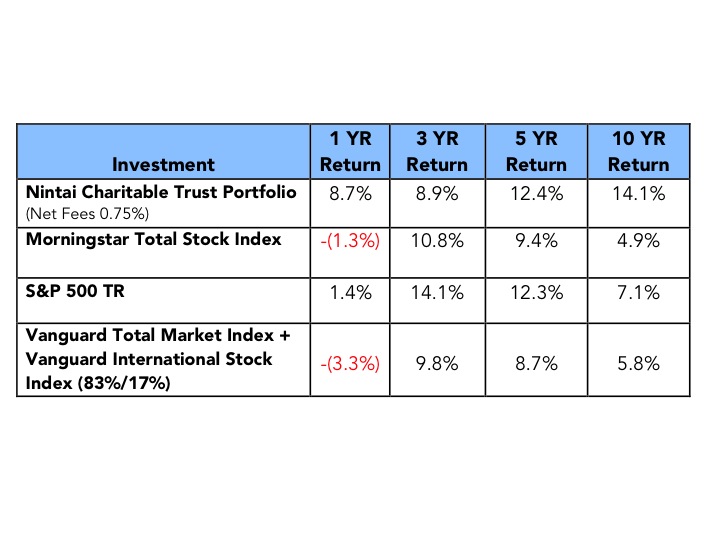
Last year saw the Charitable Trust outperform the markets for the first time in three years. The portfolio handily beat what we consider the most appropriate comparison – a blend of the Vanguard Total U.S. Stock Market Index, Vanguard Foreign Stock Market Index and money market returns. For 2015, the Nintai Portfolio returned 8.7% versus a -1.3% loss for the Morningstar U.S. Market Index and a 1.4% return for the Standard & Poor's 500 TR Index. The Charitable Trust Portfolio outperformed its recommended bogey's (80% Vanguard Total Market Index, 10% Vanguard International Stock Market Index and 10% cash) loss of -3.3%.

Historical returns
Since inception in 2004, the Nintai Charitable Trust (previously the Nintai Partners Holdings portfolio) has generated a 14.3% annual return (net fees of 0.75% annually) versus a 5.4% return for the Morningstar Total Stock Market Index and a 7.3% return for the S&P 500 TR. An investment of $100,000 in the Nintai portfolio in 2004 is currently worth (net fees) $435,000 versus $178,000 for the Morningstar Total Stock Index and $217,000 for the S&P 500 TR. A blend of Vanguard Total Market Index and Vanguard International Stock Index (rebalanced each year to reflect Nintai’s percentages) produced an annual return of 4.2% leaving an investor with $157,000 after the same period.
The following are comparative historic returns:

Picture
A couple of things to keep in mind: The Morningstar Total Stock Index and S&P 500 Total Return Index have actually outperformed us over the past three years. While disappointing, we believe our long-term performance demonstrates the value of our investment philosophy. Second, we believe Nintai earned its management fee in 2008 when the portfolio lost less that 17% versus losses of well over 35% for most of the markets. As we’ve mentioned previously, sometimes the best value we can add is by not losing rather than trying to shoot the lights out.
Conclusions
Even though the Nintai Charitable Trust portfolio has underperformed both the S&P 500 and Morningstar Stock Market Index on a three-year basis, we are quite comfortable with our holdings and positions. The current PE of our portfolio is 19.5, or roughly equal with the S&P 500. In addition the portfolio has an average ROA of 22.2% and an ROE of 34.9%. Respectively, these are roughly double and 70% higher than the S&P 500. Finally, projected earnings growth over the next five years is projected at 12.6% or roughly 30% greater than the S&P 500. In essence the Nintai Portfolio is equally priced to the index, but far more profitable than the broader markets and expected to grow considerably faster. This is a situation we are very comfortable to remain fully invested and quite patient.
Over the past 10 years, we have a turnover ratio of roughly 5% to 7% annually. Last year was certainly an anomaly in that record. However, we expect to return to that average in 2016. Each of the companies in the portfolio share common characteristics – excellent profitability signified by high ROA, ROE, and ROIC, little to no debt, management who are great allocators of capital, and they were purchased at a significant discount to fair value.
As the new year dawns, I have much to be thankful for professionally and personally. To the investors in the Nintai Charitable Trust and Nintai Partners, I owe an enormous debt of gratitude for having the patience to hang in there after three years of underperformance. To my readers at GuruFocus, I am indebted for all their comments, criticisms and questions. You never cease to help me grow. Last, to my family and friends, a grateful thank you for all their support and love that makes life such a pleasure in living. I wish everyone a very prosperous, happy and healthy New Year.
​
1 Comment

investment management and fiduciary responsibility

1/2/2016

0 Comments

 
“It's that wonderful old-fashioned idea that others come first and you come second. This was the whole ethic by which I was brought up”.
 
                                                               - Audrey Hepburn
 
“Being a good fiduciary really isn’t that hard. But then again neither is investing. Yet it seems so difficult to find financial agents who truly believe their clients come first. Why is it so difficult to help your client maximize their returns and receive fair compensation for your services? Not sell them products they shouldn’t own, charge them too much, and line the pocket of the financial industry. Is that really too much to ask? Wait. Don’t answer that.”
 
                                                               - Ralph Dungan
 
Fiduciary Responsibility
 
One of the first things you have drilled into you as you prepare to take the Series 65 examination is the role of fiduciary responsibility. Under this theory you have to act with loyalty, prudence, and care, and act in the best interests of the client. A second responsibility is “suitability.” It requires that as an advisor you avoid recommending unsuitable investments based on the customer’s general investment experience, level of investor sophistication, and risk tolerance.
 
Perhaps I’m old fashioned, but it would seem to me placing your client’s financial needs in front of your own must be a prerequisite to success. But this type of thinking is apparently out dated. Recently the Department of Labor proposed a Conflict of Interest Rule attempting to target the all too often practice of recommending unsuitable investment products to retirees[1]. The industry has responded in a manner that can only raise eyebrows. A typical response can be found in a recent article on InsuranceNewsNet.  
 
“Investors should expect to see financial advisors stampede out of the market if fiduciary rules proposed by the U.S. Department of Labor (DOL) are adopted. That’s the view from industry lobbyists and executives representing insurance companies, broker/dealers, mutual funds and financial advisors”.[2]
 
Really? The idea their own financial needs should be secondary to their clients might create a stampede of advisors for the exit door? If true, this is a sad statement about the career focus of many advisers.
 
An Example
 
An example of this targeted behavior is a series of recent transactions in my own family. A relative - aged 76 - has two trusts and an IRA of significant value. Her money - managed by a bank wealth management group - came with clear written instructions to avoid any investments of higher risk. In case this wasn't clear, a document was drafted prohibiting several examples including the specific use of leverage. You can imagine our surprise when she showed me her statement and we saw not one but three funds investing in high yield debt instruments using at least 40% leverage.  
 
Wondering how these selections came into her portfolio, one is likely to have several thoughts on the bank’s investment and asset management team.
  1. The team’s risk assessment group might be unclear that high debt instruments combined with leverage are higher risk in nature.
  2. The team’s portfolio management group might be unaware of the client’s specific requests related to risk.
  3. The bank’s client services team might not have the ability to communicate with the third party portfolio managers they’ve hired to reduce costs.
  4. The bank’s client management group, the bank’s senior management, and the third party investment group might care little - or no nothing about - about fiduciary responsibility and the concept of “suitability”.
  5. The bank’s client management team, the bank’s senior management, and the third party investment group might have financial incentives to purchase these funds.
 
I have to be honest. None of these five choices give you a helluva lot of confidence that the bank and all its minions are very clear of their role as a fiduciary steward.  And this from a mid-sized financial institution holding itself out as “your partner in making your future possible”.   
 
Why This Matters
 
It would seem that talk of wholesale resignations and departures (along with the $11M spent on Congressional lobbying) indicates the financial industry places little value on the need to address conflict of interest. But it should matter - vitally and passionately - to those who are financial stewards. Here’s why:  
 
Investment Management Should Be A Profession…Not An Industry
Much like healthcare, when the role of stewards is seen as an industry rather than a profession, the job will likely attract the wrong people. It is an extraordinary honor to serve as the financial custodian at the Nintai Charitable Trust. I feel a deep sense of obligation to meet my client’s needs – the long-term growth of the trust’s assets enabling it to make a significant contribution to our society over time. By purchasing assets that do not meet the Trust’s goals, assuming risk that endangers their returns, or having relationships where my profits might be passed off to my client as an expense, I will have failed my fiduciary requirements as an investment advisor. If the Trust does well, I will be compensated accordingly. The Trust is not an asset to be used to fund my social proclivities, financial desires, or be seen as a business opportunity for accomplices in a fee sharing agreement.
 
Your Clients’ Returns Depend On It
As I’ve said many times, expenses matter. A lot. Every penny that comes from returns is magnified over the life of the client returns. This should matter. Your client’s returns are based a good deal on how you can minimize costs. Making the future possible to any client should be the ultimate goal of an investment advisor. Placing them in high cost offerings, charging high fees, and placing your needs above theirs’ should – and cannot - be a part of their investment operations. 
 
It’s Already There in Writing
Starting with the Public Utility Holding Company Act of 1935[3] through to the passage of the Investment Company Act and the Investment Advisers Act in 1940 (and far beyond), there has been an effort to assure that investment advisors place their client needs first. The proposed DoL regulations are simply further articulation of that concept. The fact that so many financial institutions are agonizing over this proposal is a sad commentary on how we currently see our role as fiduciary stewards.
 
Conclusions
I consider it an honor and a great responsibility when someone lets me manage their dearly earned savings. As a Registered Investment Advisor your role is to provide a client with best possible chance at achieving their financial goals.  Hard as it may seem to some members of the investment community, the ability to place the client’s needs before those of yours is the legal and ethical definition of investment management.  Perhaps it is time we call the bluff of so many of these individuals who claim the new rules will force them out of the investment management business. Over time their departure could be a net gain for our investor class as well as our professional class. Looking at results over the past ten years that might be a risk worth taking.
 
   
[1] The proposed changes can be read here: http://www.dol.gov/ebsa/regs/conflictsofinterest.html

[2] http://insurancenewsnet.com/innarticle/2015/08/28/would-advisors-abandon-the-market-over-fiduciary-rules.html

[3] This Act authorized the Securities and Exchange Commission (SEC) to study investment trusts after their extraordinary performance in the post-1929 Crash. 
0 Comments

    Author

    Mr. Macpherson is the Chief Investment Officer and Managing Director of Nintai Investments LLC. 

    Archives

    May 2025
    April 2025
    March 2025
    February 2025
    January 2025
    December 2024
    November 2024
    September 2024
    July 2024
    June 2024
    May 2024
    February 2024
    January 2024
    December 2023
    November 2023
    September 2023
    August 2023
    July 2023
    June 2023
    May 2023
    April 2023
    March 2023
    February 2023
    January 2023
    December 2022
    November 2022
    October 2022
    September 2022
    August 2022
    July 2022
    June 2022
    May 2022
    April 2022
    March 2022
    December 2021
    October 2021
    August 2021
    July 2021
    June 2021
    May 2021
    April 2021
    March 2021
    February 2021
    January 2021
    December 2020
    October 2020
    September 2020
    August 2020
    July 2020
    June 2020
    May 2020
    April 2020
    March 2020
    February 2020
    January 2020
    December 2019
    November 2019
    September 2019
    August 2019
    July 2019
    June 2019
    May 2019
    April 2019
    March 2019
    January 2019
    December 2018
    November 2018
    October 2018
    September 2018
    July 2018
    June 2018
    May 2018
    March 2018
    February 2018
    December 2017
    September 2017
    August 2017
    June 2017
    May 2017
    April 2017
    March 2017
    January 2017
    December 2016
    November 2016
    October 2016
    August 2016
    July 2016
    June 2016
    May 2016
    April 2016
    March 2016
    February 2016
    January 2016
    December 2015
    November 2015
    October 2015
    September 2015
    August 2015
    July 2015
    June 2015
    May 2015
    April 2015
    March 2015
    February 2015
    January 2015
    December 2014

    Categories

    All

    RSS Feed

Proudly powered by Weebly