“Excellence is a continuous process and not an accident.”
- A. P. J. Abdul Kalam
“Business, more than any other occupation, is a continual dealing with the future; it is a continual calculation, an instinctive exercise in foresight.”
- Henry R. Luce
In this second of a three-part series, I walk readers through some of the functional elements of my valuation tool set and their role in calculating intrinsic value.
Successful investing is as much a failure-prevention process as it is looking for undervalued growth opportunities. Henry Petroski once said, “Failure is central to engineering. Every single calculation that an engineer makes is a failure calculation. Successful engineering is all about understanding how things break or fail.”[1] Value investing is no different. Great investors avoid failure (most of the time!) by understanding the elements that often lead to failure.
My discounted cash flow (DCF) spreadsheet tool is used to answer the five questions mentioned in Part 1. These were:
To answer these questions, I’ve selected some of the major categories in the tool set I find helpful in calculating intrinsic value. These aren’t a complete list. A full description of the total functionality of the tool would take a small book that would – with all likelihood – be a bestseller at the “American Society of Chronic Sleeplessness” annual meetings.
Rate of Return
By way of illustration, in this column we will do a calculation to see which is a better deal – a 10-year US Treasury note (risk free, in all probability), or the potential investment. I use two measures as modeled by Warren Buffett – rate of return by P/E ratio and rate of return by earnings growth. Both methods of this approach allow an investor to make a reasonable projection of value going forward if the company has a competitive moat and steady earnings growth. I should point out this method is less effective with companies that have extremely lumpy earnings or no competitive moat. Both numbers should be significantly higher than the current yield on the 10-year Treasury. I look for a company that I expect to achieve 20% or greater in both rates of return.
Balance Sheet Strength
A strong balance sheet allows a company both offensive and defensive options. In the case of a significant downturn the company can rely on cash on the balance sheet to fund operations (defensive) or acquire undervalued competitors (offensive). I use three measures: Cash as a percent of assets, cash as a percent of liabilities, and cash used as reduction of P/E. Generally, I look for companies that have 50% or more of assets in cash and 100% or more of liabilities. This process protects me on the downside from potential blow ups that can lead to permanent capital impairment for my investors.
Free Cash Flow Yield
Free cash flow yield is another simple calculation that tells you the general value (and risk) of your potential investment again a 10 treasury. You can do two different measures dependent your own personal values. Some use a free cash flow variant while others use an earnings variant. I happen to use both and look for the free cash and earnings yield to be at 15 - 20% or greater than the yield on a 10 Treasury.
Return on Invested Capital
The difference between return on invested capital (ROIC) and return on allocated capital (ROAC) is that the latter tells us more about management while the former tells us more about the business’ characteristics. Return on invested capital can be calculated in hundreds of ways. The formula I prefer to use is the following:
- A. P. J. Abdul Kalam
“Business, more than any other occupation, is a continual dealing with the future; it is a continual calculation, an instinctive exercise in foresight.”
- Henry R. Luce
In this second of a three-part series, I walk readers through some of the functional elements of my valuation tool set and their role in calculating intrinsic value.
Successful investing is as much a failure-prevention process as it is looking for undervalued growth opportunities. Henry Petroski once said, “Failure is central to engineering. Every single calculation that an engineer makes is a failure calculation. Successful engineering is all about understanding how things break or fail.”[1] Value investing is no different. Great investors avoid failure (most of the time!) by understanding the elements that often lead to failure.
My discounted cash flow (DCF) spreadsheet tool is used to answer the five questions mentioned in Part 1. These were:
- Are managers great allocators of capital? Do they use assets to drive future growth (hopefully highly profitable) over the long-term?
- Does the company have the financial strength to shake off even the most severe economic or financial challenges?
- Does the company have the ability to earn a return on capital greater than its weighted cost of capital over a 10 - 20 year time horizon?
- Does the company have the ability to beat competitors over the same time horizon?
- Calculate whether the share price is indicative of an adequate margin of safety to purchase, hold, or sell.
To answer these questions, I’ve selected some of the major categories in the tool set I find helpful in calculating intrinsic value. These aren’t a complete list. A full description of the total functionality of the tool would take a small book that would – with all likelihood – be a bestseller at the “American Society of Chronic Sleeplessness” annual meetings.
Rate of Return
By way of illustration, in this column we will do a calculation to see which is a better deal – a 10-year US Treasury note (risk free, in all probability), or the potential investment. I use two measures as modeled by Warren Buffett – rate of return by P/E ratio and rate of return by earnings growth. Both methods of this approach allow an investor to make a reasonable projection of value going forward if the company has a competitive moat and steady earnings growth. I should point out this method is less effective with companies that have extremely lumpy earnings or no competitive moat. Both numbers should be significantly higher than the current yield on the 10-year Treasury. I look for a company that I expect to achieve 20% or greater in both rates of return.
Balance Sheet Strength
A strong balance sheet allows a company both offensive and defensive options. In the case of a significant downturn the company can rely on cash on the balance sheet to fund operations (defensive) or acquire undervalued competitors (offensive). I use three measures: Cash as a percent of assets, cash as a percent of liabilities, and cash used as reduction of P/E. Generally, I look for companies that have 50% or more of assets in cash and 100% or more of liabilities. This process protects me on the downside from potential blow ups that can lead to permanent capital impairment for my investors.
Free Cash Flow Yield
Free cash flow yield is another simple calculation that tells you the general value (and risk) of your potential investment again a 10 treasury. You can do two different measures dependent your own personal values. Some use a free cash flow variant while others use an earnings variant. I happen to use both and look for the free cash and earnings yield to be at 15 - 20% or greater than the yield on a 10 Treasury.
Return on Invested Capital
The difference between return on invested capital (ROIC) and return on allocated capital (ROAC) is that the latter tells us more about management while the former tells us more about the business’ characteristics. Return on invested capital can be calculated in hundreds of ways. The formula I prefer to use is the following:
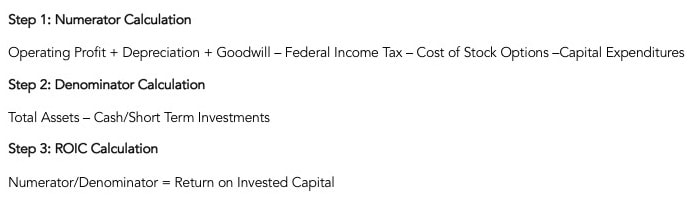
This calculation removes some of the numbers that can skew ROIC numbers. Companies with large goodwill or cash on the balance sheet can see ROIC be highly inflated or deflated in a manner that means very little as to the company’s return on invested capital.
Return on Allocated Capital
Return on allocated capital is measured quite differently from return on invested capital. Here I’m looking to see how good management’s skill is in allocating retained earnings. There is no more important job for management than allocation of capital. It’s very difficult to see long-term profitable growth if your investment’s managers unwisely use retained earnings and cash to grow (or shrink!) the business. The formula used in this case:
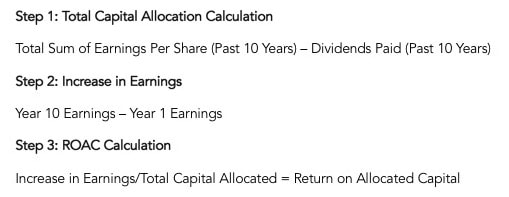
Using both ROIC and ROAC gives a varied look at the profitability of your investment (along with others such as free cash flow yield). Combined with these measures is return on equity (ROE) and return on assets (ROA). For ROIC and ROAC I look for 25% or greater and 15% or greater for ROE and ROA.
Cash Return
The cash return formula measures how efficiently the business is using its capital -- both equity and debt -- to generate free cash flow. The formula is free cash flow + net interest expense divided by enterprise value. I generally look for a cash return of 7% or greater.
IRR Treasury Review (or Buffett’s “Equity Bond”)
This is a wonderful tool used by Warren Buffett to quickly size up your expected internal rate of return (IRR) in a stock versus the IRR of a 10-year US Treasury. By utilizing the last 10 years earnings, an investor can identify what price is necessary to meet the Treasury’s return. This is another great tool to assess the risk premium you are being paying versus a risk-free asset.
Discounted Free Cash Flow (Intrinsic Value)
A discounted free cash (DCF) model uses future free cash flow projections and discounts them - using a required annual rate - to arrive at present value estimates. That present value estimate is then used to evaluate the potential for investment. There are several things that impact a DCF model – the current share price, the number of shares, current free cash flow, estimated 10-year FCF growth rate, perpetuity growth rate, and discount rate. The first three need no description but the final three can be quite subjective. For an estimated free cash flow growth rate, I generally start by looking at the last 10 years rate, halving it, then sometimes halving it again. I vary this discount depending on my level of uncertainty but generally discount it by 50 – 85%. In almost all case I attempt to break my investment case by halving the 10 year rate and then halving it again. As an investor, the level of discount is really dependent upon your comfort level of your estimate. My suggestion is that whaever number you finally come up with halve it. That’s what’s called a margin of safety!
Always assume the worst and build from there. For a perpetuity growth rate some use 4% but I think this is too aggressive; I use 3% on average. Finally, to calculate the discount rate I start with current 10-year Treasury rate and then add on for company size, financial leverage, cyclicality, management governance, economic moat, complexity of business and its previous weighted average cost of capital (WACC). Dependent on these factors, a discount rate can range from 7% - 13%. As I’ve stressed before, the use of a DCF model should give an estimated intrinsic value – not an exact intrinsic value. It should also demonstrate whether the current price provides an adequate margin of safety.
As an aside, you can pull up companies either in my portfolios or watch lists by creating the following screen on Gurufocus.
Debt-to-Equity 0%
Return on Assets (10 Year) >15%
Return on Equity (10 Year) >15%
Return on Capital (10 Year) >15%
This screen will generally get you to about 150 companies or less.
Part 3 in this series will utilize a case study of a company on my watch list and former holding in the Nintai Charitable Trust.
As always, I look forward to your thoughts and comments.
[1] Petroski is a professor of civil engineering and history at Duke University. His “To Engineer is Human: The Role of Failure in Successful Design” (Vintage Press, 1985) is considered a classic and I recommend everyone read it at least once in their investing career.
 RSS Feed