NINTAI INVESTMENTS
  • About
  • Nintai Insights
  • Recommended Reading
  • Contact
  • Performance
  • Client Forms

Excitement And Action: A Day In The Life

6/29/2015

0 Comments

 
Many people have asked us about our turnover rates, investment criteria and what we do during an average day at Nintai. These have all been interesting to answer, but last week we got a particularly interesting question that really touched on some of our core values. A reader asked us a.) what makes up a standard day and b.) what constitutes an exciting day at Nintai. As we talked about it, it became quite clear that what gets our juices flowing is something quite different than the average Wall Street shop. We don't say this in a boastful way. It’s just that the way we work - from an intellectual, emotional, and organizational manner – is very, very different than the average retail investor or asset manager.

The day is quiet … really quiet 

The one thing everyone seems to notice in a visit to our offices is how little noise and motion there is. An average day for us is one where we can spend a considerable amount of time reading, thinking and discussing current or proposed holdings. The ability to think (and here we mean truly think) is directly proportional to the activity that doesn’t take place in the portfolio. In a study published in 2011[1], researchers found that nearly 80% of their subject matter’s time was spent on trading (writing trading contracts, buying, selling, etc.). How someone can truly understand investment holdings when so much time is spent buying and selling is beyond us.

The day we can find an interesting prospect 

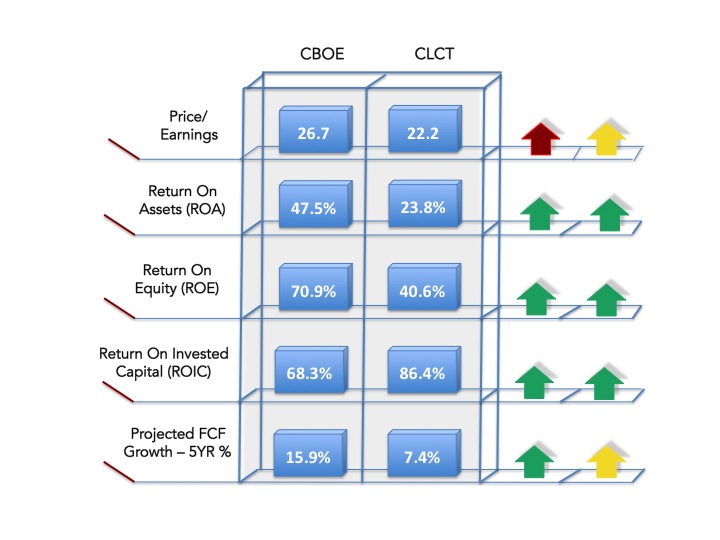
The past two weeks we have spent researching in great detail two stocks – CBOE Holdings (CBOE) and Collectors Universe (CLCT). The stocks have been on our watch list for four and two years, respectively. These past two weeks we have rolled up our sleeves and conducted rigorous analyses on each. For CBOE this includes interviewing roughly 35 individuals including senior management, regulatory officials, legislative aides and industry leaders. In addition, we’ve read each annual report from 2000 to 2014. We’ve hired several consultants to create reports including the future of market index options, the VIX as an investing option, corporate stock options, and exchange traded funds/notes. We have also commissioned a study on the technology (data, informatics, platforms, exchanges) related to CBOEs Hybrid Trading Model (HTM). Additionally we have spent the past several weeks conducting deep research on Collectors Universe. As part of a duopoly (along with NGC), we absolutely love the company and its business model. Our research has focused on the potential growth in the collectables markets, potential impact of tax code changes, growth of government collectables initiatives (such as the gold presidential first lady coins) and the latest technologies including RFID embedded track and trace systems. During this time roughly 75% of our research is conducted in the office utilizing the phone or iChat/Skype to conduct interviews. The remaining 25% is spent on the ground either at the customer’s headquarters/operations center or visiting competitive sites.

The following is a high level evaluation of some of our investment criteria on an Abacus screen:
Picture
All of this takes considerable time and effort and a great deal of each day has been spent understanding, discussing and debating the meaning of our research. These days and weeks studying may seem extraordinarily dull to the average Wall Street investor, but we believe they are essential if we are to obtain a long-term advantage against both retail investors and other asset managers. Upon completing this research, if we believe we’ve found two potential investments opportunities for the Nintai portfolio, then it has been time most productive and interesting. (In this case both cases have turned out to be well worth their while). If for some reason we come away from this research with a negative outlook we still feel this has been time well spent. Any data we can add to our mental models allows us to see connections and trends we might never have seen before. The accumulation of knowledge (through new models. new data sets, or interactive trends) is one of our strongest competitive advantages.

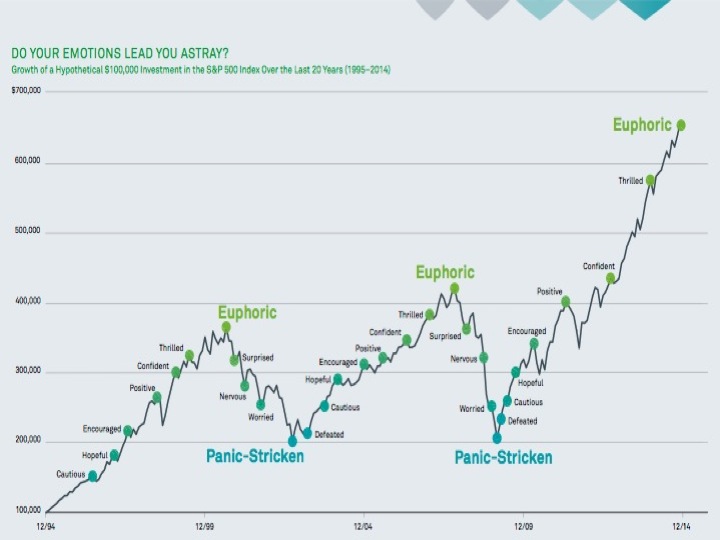
The day the markets drop ... a lot 

To answer the second part of our reader’s question, a most exciting day for us is when the markets drop. The greater the drop the more the excitement. We recognize people perceive it as very odd when we verbalize our frustration when the markets jump 3-4% on seemingly innocuous news. But nothing gets our competitive juices flowing more than a panicky sell off that impacts stock prices across the board. We think this represents the greatest predictor of whether an investor will be successful or not in the long term. The best possible culmination of such a day is the ability to purchase either a new stock from our watch list or to add to an existing position. Equally important is being ready when these days happen. In the case of CBOE or CLTC, we are comfortable pulling the trigger on any given day knowing we have prepared ourselves – intellectually and emotionally - in nearly every conceivable manner. Preparation is the oxygen of a successful investing environment.

Conclusions

The past several weeks in the office have been ideal for our team as we got the chance to delve into two watch list stocks. This research – along with the associated lack of noise and distractions – has allowed to build extensive data and mental models that will allow us to make well-educated, data-driven, value-based investment decisions. Over the next several days we will create the investment (price) based criteria that will drive our purchase decisions (if there are any). We hope this helps answer our reader’s question about our average day.

As always we look forward to hearing your thoughts and comments.

[1] “Individual Investors and Volatility”, Thierry Foucault, David Sraer, and David J. Thesmar, The Journal of Finance, Volume LXVI, No. 4, August, 2011


0 Comments

Emotions In Motion: Data, Sentiment, And Investing

6/18/2015

1 Comment

 
“Emotions are jolted by too much information and the wrong type of information. That’s the problem today – too much information that has nothing to do with value.” - Goldman Sachs

“There are three emotions that will really do you in as an investor – hope, greed, and fear. The first two will lock you in making you think you are a real genius, while the third eviscerates your investment return. You can never fully avoid these, but strengthen yourself to take advantage of them.” – John Rutherford

“Only when you combine sound intellect with emotional discipline do you get rational behavior.” – Warren Buffett (Trades, Portfolio)


Some recent articles by our favorite writers – Grahamites and Science of Hitting – got us thinking about an issue we write about every three or four years – emotions and data in investing. It seems about the time of every market top (or at least 6 of the last 3….), we write an article on the ability to face down your own fears and make money the only way great investors do – purchasing stocks at a substantial discount to fair value. It seems so easy. Wait for a really significant correction, step in, and purchase some great stocks. The rest is investment history. Or at least that's what they say.

Reality has a way of getting in the way of such elucidated thinking. The bottom line is that the vast majority of investors take in far too much information, overreact far too vividly to too much data, blame others for their poor results, and begin the cycle all over again. For the first instance, in a classic study[1] by Richard Thaler, subjects managed an imaginary college endowment consisting of two mutual funds. They could choose how often they received information about fund performance and how often they could trade. The experiment simulated 25 years of investing. The results were clear - participants who received information once every five years, and could trade only that often, earned returns that were more than twice those of participants who were updated monthly and could trade that frequently. The bottom line was that the frequency and amount of data availability directly correlated to poorer returns.

Not only do investors who receive too much data trade more frequently and obtain worse returns, their emotions generally proceed in a rather standard format, rising from a state of panic to euphoria. You can imagine where the latter leaves us in the market cycle. In a recent study by Blackrock[2], the investment team created an outstanding graphic demonstration of the emotions by many investors during stock market phases. By 2014, we feel we’ve seen this movie too.

Picture
After the peak of euphoria comes the inevitable retreat in prices. As these losses get broader and deeper, emotions emerge which lead investors to make some very expensive decisions. One of the most prevalent is denial – or that we never like to take the blame for our losing choices. In a remarkable study[3], Tom Chang (University of Southern California), David H. Solomon (University of Southern California), and Mark M. Westerfield (University of Washington), demonstrated that cognitive dissonance will go to almost any length to protect our own inflated view of our abilities. In the final analysis, someone else must be at fault for making these bone-headed decisions to buy stocks with P/Es of 87 and trading at all time highs. And here we come full circle – for the only people who can be blamed are the talking heads we spend 7 hours a day shouting their enthusiasm, wisdom, and predictions.

Why This Matters

So what can we do about this (un) virtuous cycle that seems to repeat itself every decade? How do prepare ourselves as individual investors and set up systems to prevent these behaviors. We would humbly recommend the following steps.

Focus On Value, Not Price

A great start is shutting off every television, radio, SATlink, or Bloomberg in your office right now. We then highly suggest using whatever model you choose – DCF, DDM, etc. and calculate the value of each and every one of your holdings. Do this irrespective of any knowledge you might have related to its price. Then – and only then – use Yahoo! Finance to look at the price. If your estimated value is above its current price, then think long and hard about whether this position is worth holding. At Nintai, we have no Bloomberg and no television in our office. Our focus is constantly on value – a cold hearted evaluation on the specifics of the company. If a prospect meets our criteria, than and only then, do we look up its price relative to its value. After that, we simply use a limit order to watch the price for us. 99% of our time is spent on value not price. 99% of what you hear on the financial media is about price rather than value. Turning it off will be one of the best investment decisions you will ever make.

No One But You Pulls the Trigger

In the final analysis no one makes the decision to buy or sell but yourself (unless you use an investment manager). Your decisions will ultimately produce the short and long-term investment outcomes that have such an impact on your financial future. Poor outcomes are a measure of two things – your emotional ability to make rationale buy/sell judgments and your ability to weigh value versus price of each investment you make. Poor returns are a reflection of failure in one or both of these attributes. Only you can remedy these problems.

There’s No Better Time than the Present

With markets at all time highs and investors reaching euphoric levels, there is no better time to shut off all the media, load up on corporate 10-K/Qs, and roll up your sleeves to evaluate each of your holdings. It’s amazing how everyone (and I mean everyone!) can allow great news to bleed into our assumptions and business cases for our holdings. Be ruthless in your evaluations, invert your estimates, and build in truly horrific assumptions. After you’ve completed this, silently slip back to your computer and check the price. After evaluating your intrinsic value against price, make the decision to buy, hold or sell. Then shut the computer off. However you choose to implement this model, do it now. There is no time better than the present. We can’t guarantee investment success with this method, but we would suggest the odds are in your favor of outperforming the vast majority of individual investors and money managers.

Conclusions

We live in an age where information is available 24/7. Most of this information provides absolutely no function in evaluating value of our specific holdings. More importantly, the information is provided in a format as to play on our emotions. Finally, we live with a human brain that looks in every possible way to blame others for our failures yet make us feel like genius for our successes. These three factors play an inordinate role in the truly horrific losses occurred every so often when we face significant market corrections. By limiting our data intake, creating models with our own intellect focused on value, and building systems to minimize emotional responses, we can prevent such losses. In the final analysis, these steps will help (but not guarantee) make you an investor that outperforms the markets in the long term.

[1] http://www.kiplinger.com/article/investing/T031-C000-S002-investors-beware-the-pitfalls-of-too-much-informat.html#vVckyWKBZKIp7JFL.99

[2] https://www.blackrock.com/investing/literature/investor-education/investing-and-emotions-one-pager-va-us.pdf

[3] “Looking for Someone to Blame: Delegation, Cognitive Dissonance, and the Disposition Effect”, Tom Chang, David H. Solomon, Mark M. Westerfield, October 2014, available at SSRN


1 Comment

margin of safety: how much is enough?

6/9/2015

0 Comments

 
Picture
Our recent purchase of Intuitive Surgical (ISRG) has prompted many of our readers to question the investment case – and in particular the margin of safety – behind the transaction. These are great questions that force us to describe and justify our methodology and question our assumptions. We greatly appreciate the feedback.

Since Ben Graham’s first wrote about his concept of “margin of safety”, there has been a general consensus about the definition of the term. We think Seth Klarman said it best when he stated that a margin of safety “is achieved when securities are purchased at prices sufficiently below underlying value to allow for human error, bad luck, or extreme volatility in a complex, unpredictable and rapidly changing world”[1]. For most value investors, the idea of utilizing margin of safety as the bedrock for their investment process is essential to their success. The idea of a value guru purchasing an investment at a price equal to or exceeding its fair value is so flawed as to be ludicrous in nature.

 That said, defining what is an adequate margin of safety is something that remains uniquely personal for each value investor. Some investors use percentages (“at least a 25% discount to estimated intrinsic value”) while others might use a multiple (“less than 3 x enterprise value as calculated by recent M&A activity”). Nintai is no different. We employ a unique process that allows for a customized approach to every investment opportunity.

 Nintai’s Requirements: Margin of Safety

 First, we should emphasize that margin of safety as a concept is never negotiable in our investment process. We will never pay fair value for a prospective holding. That said, how much of a margin of safety is flexible and is dependent upon multiple investment characteristics and certain market dynamics. When calculating an appropriate margin of safety, Nintai uses both specific corporate data as well as risk/uncertainty trends to assess the size of the margin required for investment. As many readers asked questions about our purchase of Intuitive Surgical (ISRG) last week, we thought we’d use the company as a use case in today’s article.

 1. Corporate Measures: Impact on Margin of Safety

To assign what we think is an appropriate margin of safety in our investments, we begin with key corporate measures. These include the strength of the balance sheet, percentage of revenue converted to free cash, trend of gross and net margins, return on capital, and the strength/makeup of earnings growth over the next five years (amongst many others).

Seen below is a Nintai Abacus report outlining the value assigned to some of the criteria (1 being worst and 10 being the best) and its impact on the margin of safety. For example, ISRG’s balance sheet receives a score of 9.9 with no short or long-term debt and reduces the margin of safety required by 0.25%. Overall, this screen represents 5 corporate criteria which taken in total reduce the required margin of safety by 0.55%.

At Nintai, we use a total of 17 corporate criteria that can impact the required margin of safety by up to 5% in total.

2. Risk and Uncertainty Measures: Impact on Margin of Safety

In addition to certain corporate criteria, Nintai looks at multiple characteristics surrounding risk and uncertainty that might impact our required margin of safety. Seen below is the Nintai Abacus report outlining the value assigned to the criteria (1 being worst and 10 being the best) and its impact on the margin of safety. For example, ISRG’s risk relative to competition rates an 8.8 reflecting the failure of two competitors to achieve gold standard of care in their respective therapeutic groups as well as the failure of a third competitor to achieve its primary endpoints in a study for their product. This score reduces the margin of safety required by 0.25%. 
Picture
At Nintai, we use a total of 12 risk/uncertainty criteria that can impact the required margin of safety by up to 3% in total.

Conclusions

At Nintai we don’t have a set margin of safety (25% below estimated intrinsic value) that we require, but rather a process that looks to quantify the best estimate by individual company. By no means is this process static. When we review each holding on a quarterly basis, we will reevaluate each and every characteristic. We recognize this process is time consuming and requires extensive knowledge, data, and industrial expertise. With such a focused portfolio, we believe the process requires such an intricate methodology. Overall, we believe our long-term performance bears out the value of such a process. We hope this answers some of the great questions we received over the past week.

 As always, we look forward to your thoughts and comments.


0 Comments

A Purchase and a Sale at nintai

6/4/2015

0 Comments

 
Over the past several weeks, we’ve had several investment partners of Nintai question our decisions to purchase stocks with the markets at mostly all-time highs. It’s a reasonable question to ask and one we never get tired of answering. First, we believe that while markets are fairly priced at this stage, it’s important to understand every market is a sum of individual companies. Individual equities can – and probably will – trade at ranges quite distinct from market returns. We believe this makes for investment opportunities even though the markets may seem quite pricey. With that in mind, we made some changes to the Nintai Portfolio over the past few days including one sale and one new purchase.

BUY: Intuitive Surgical (ISRG)

We sold ISRG in 2012 after holding it for roughly 16 months after it ran away from us and reached a price far in excess of our estimated fair value. With 20/20 hindsight we made a relatively smart move for which we can take absolutely no credit. Since our sale, the stock returned roughly 14% versus the S&P 500 TR return of 65%. However, it should be noted we were right for the wrong reasons. In our calculations at the time we had free cash flow rising to roughly $700M by 2014. Looking at ISRG’s free cash flow, one might think we were slightly too optimistic in our projections.

Not shown in these numbers are two important decisions by ISRG management. First, was management’s decision that the company was undervalued after share price decreases in 2013 and 2014. The second was management’s decision to aggressively purchase roughly $2B in shares through the open market utilizing free cash during this period. Shares outstanding have decreased from 41.1M at year-end 2012 to 37.7M by year-end 2014. Taking that into account, free cash flow would have nearly doubled in the years 2013 and 2014 making the numbers starting in 2010 the following:

In essence, the company had generated roughly $1.6B in free cash in 2014 versus our estimate made in 2012 of $700M. Boy, did we get that wrong! When we factored in this new growth rate, we significantly increased our fair value of ISRG reflecting the value of cash and time.

This is simply one part of why we have purchased the stock. We also believe they have answered several questions we thought could greatly impact future growth. These included settlements with the FDA, clear market acceptance of robotic surgery in new therapeutic groups, and maintaining a clear dominance in the field. Utilizing our median growth model we believe the company is worth $532/share. Accordingly we added ISRG to the Nintai portfolio on Friday, May 29 at $486.34/share.

SELL: Cognizant Technology (CTSH)

Our decision to sell Cognizant is based on two reasons. First, Nintai believes the company’s base valuation is roughly $63/share. Currently trading at roughly $65/share, we would have been comfortable holding the company for the foreseeable future. Unfortunately, the company decided to take on $925M in long-term debt and $150M in short-term debt. While we completely understand the rationale for this move, this shaved roughly 6% off of our fair value estimate bringing it to roughly 10% above fair value. Combined with an internal negative financial strength rating, we believe there is simply too much risk for our investors and no reasonable case to make for an adequate return going forward. We like this space and if we could obtain a better price might have interest in Infosys (INFY) with its pristine balance sheet, high returns, and more compelling valuation.

Accordingly, we sold our entire position in CTSH on Monday, June 1 for an average price of $65.61. We first purchased the stock in November 2007 when we initiated our position at $9.11/share. Taking into account a 2:1 split in 2014, our total return was roughly 620%.

As always, we look forward to your thoughts and comments.

0 Comments

VALUATION: A holistic approach

6/3/2015

0 Comments

 
Statistics cannot be any smarter than the people who use them. And in some cases, they can make smart people do dumb things.”[1] – Charles Wheelan

A lot of the questions we get are based on how we value a company. As investment managers we think this is the most important task we have as allocators of capital. The ability to get reasonably close – not perfect – valuation of a potential investment is the predominant driver of our long-term success or failure. Yet it is by far the area where – to Wheelan’s statement – smart people make some of the dumbest mistakes (including ourselves).

Valuation methodology: Art, science or voodoo? 

I want to be completely upfront. Valuation is part science, part art and part druidic mysticism. There really isn’t any perfect way to value a company. There are simply too many moving parts, too much prognostication and frankly too much guessing. But that doesn't mean the process isn’t worth its weight in gold. At Nintai, we believe the process goal is clear: is the stock – representing a share of the business – trading at a discount to future earnings discounted back at a reasonable rate. To achieve this relatively simple goal, it takes a considerable amount of time and requires an extensive amount of research, industry expertise, and creative or flexible thinking. By the latter we mean the ability to see the data from multiple angles and make connections where there may appear none at first.

Because of the level of time and detail required we don't value that many companies per annum. Our investment criteria (see our article "Our Investment Strategy And Portfolio Selection” found here) generally leaves us with a pool of roughly 100-125 companies each year. Since 2000 we've probably fully valued roughly 250 companies and revisited these between 5-7 times since their initial review.

Valuation goals

When we finally choose one of the candidates we are going to fully investigate, we look to achieve comprehensive knowledge in four (4) major categories. These are:

  • Estimated Fair Value of the Company per Share
  • Capital Allocation Skills of Management
  • Financial Strength of the Company
  • Long Term Prognosis of Corporate Moat
Estimated fair value

We look at the calculation of fair value slightly differently than most. First, we see the process as far more than discounted free cash, margins, etc. We take a holistic approach utilizing all components of the financials including the income statement, cash flow statement, balance sheet and 10-Q/10-K guidance. We feel all these components can have a direct impact on valuation. For instance we believe movement (either positive or negative) in shares outstanding on the income statement can either reduce or increase risk and thus impact valuation. An example is Expeditors International (EXPD) that has decreased shares outstanding from 223M in 2005 to 194M in 2014. This has increased the valuation by both reducing total shares as well as decreasing risk through share repurchases. Similarly the usage of both short- and long-term debt can increase risk and impact valuation. An example of this was Cognizant Technology’s assuming $700M in short-term debt and $938M in long-term debt in 2014. While the use of debt made sense from a business perspective, from Nintai’s valuation methodology, this raised its balance sheet risk and lowered valuation.

This holistic approach can be very complex but we believe it serves two goals: first it makes us see connections where we might not see either risk or reward without it and; second it allows us to keep a constant eye on the downside. We are happy to see potential advantages during this process and still not invest, but unpleasant surprises will usually stop the valuation process dead in its tracks and ultimately take the company entirely off the watch list.

Capital allocation skills

We simply won’t invest in managements that are not exceptional capital allocators. Our valuation process evaluates long-term capital allocation rates (10 years), specific returns on acquisition and divestments, return on assets (10 years) and return on equity (10 years). Each of these evaluations is assigned a risk assessment level that directly impacts valuation. For instance, high return on capital through extraordinarily difficult times such 2008-2009 is worth more than relatively more normal periods such as 2004-2007. We feel great allocators make a larger impact on valuation during rainy days than any other time in their tenure. In general, we look for companies with ROIC of roughly 15% annually for the last 10 years. In Nintai’s model each 5% increase beyond that threshold will increase valuation by roughly 1%.

Financial strength

The ability to have access to capital – either by tapping cash on the balance sheet or through the capital markets – plays an enormous role in our valuation methodology. We think rock solid balance sheets are simply worth more than those that are not. This means we miss quite a few opportunities, but we believe it is the number one reason we have outperformed in the long run by evading the short-term capital market panics such as 2008-2009. The difference between a pristine balance sheet and one heavily leveraged can impact the valuation by +/- 10% in our model. As we mentioned, CTSH made the decision to access the capital markets in 2014 and raise a total of $1.6B. This decision – in isolation – reduced CTSH’s valuation by roughly 6% in our valuation model.

Prognosis of moat

We want to invest in compounding machines. We’ve often stated we love to have management do the heavy lifting for us. Management’s ability to find profitable and growing niches they can dominate is our dream scenario. We see this frequently in duopolies or industries that have several large leaders and many smaller competitors. In our model one tool we use to assign risk is in both the amount of market share and the movement of such market share. Companies with high existing market share as well as actively taking additional market share will have the greatest positive impact on valuation. Paychex (PAYX) and Automatic Data Processing (ADP) are examples of this duopoly model and see significant increases in fair value from these characteristics.

Conclusions

Getting to an approximate valuation is a very difficult and demanding process. It should focus on measuring things that you think will drive long-term valuation of your investment. Equally – if not more – important, it should build in processes that constantly check for downside opportunities. We cannot stress the importance of this enough. We believe far too many investments are made by not fully understanding all the issues, relationships, and interactions that can lead to truly horrific losses. As Mr. Wheelan said, our data is no better than the brains and learning we apply to it. At Nintai we have a monthly review of the valuation process to both check on performance as well as update from learnings we’ve gleaned over the past 30 days. With this process in hand, we believe you can build a base of attractive investments that meet your personal investment methodology.

As always we look forward to your thoughts and comments.


1] “Naked Statistics: Stripping the Dread from the Data,” Charles Wheelan, W. W. Norton & Company; January, 2013
0 Comments

    Author

    Mr. Macpherson is the Chief Investment Officer and Managing Director of Nintai Investments LLC. 

    Archives

    January 2023
    December 2022
    November 2022
    October 2022
    September 2022
    August 2022
    July 2022
    June 2022
    May 2022
    April 2022
    March 2022
    December 2021
    October 2021
    August 2021
    July 2021
    June 2021
    May 2021
    April 2021
    March 2021
    February 2021
    January 2021
    December 2020
    October 2020
    September 2020
    August 2020
    July 2020
    June 2020
    May 2020
    April 2020
    March 2020
    February 2020
    January 2020
    December 2019
    November 2019
    September 2019
    August 2019
    July 2019
    June 2019
    May 2019
    April 2019
    March 2019
    January 2019
    December 2018
    November 2018
    October 2018
    September 2018
    July 2018
    June 2018
    May 2018
    March 2018
    February 2018
    December 2017
    September 2017
    August 2017
    June 2017
    May 2017
    April 2017
    March 2017
    January 2017
    December 2016
    November 2016
    October 2016
    August 2016
    July 2016
    June 2016
    May 2016
    April 2016
    March 2016
    February 2016
    January 2016
    December 2015
    November 2015
    October 2015
    September 2015
    August 2015
    July 2015
    June 2015
    May 2015
    April 2015
    March 2015
    February 2015
    January 2015
    December 2014

    Categories

    All

    RSS Feed

Proudly powered by Weebly