"When you combine ignorance and leverage, you get some pretty interesting results."
- Warren Buffett
Margin Debt: A Brief History
Margin debt is when an investor uses assets provided by a third party - in many cases, the investor's brokerage house - to purchase more shares than they usually could using just the cash assets available to them at the time of purchase. This means opening a margin account and utilizing the credit line on the account to make such a purchase. For instance, assume an investor has $1,000,000 in cash in their brokerage sweep account to make purchases. Also, they have a margin account with a credit limit of $500,000. The investor wants to purchase $1,000,000 worth of a particular stock. They can use the $750,000 available in their sweep account, and they borrow $250,000 on their margin account and make the purchase. This means the investor has $250,000 in cash as collateral for the $250,000 balance on their margin account. This has allowed the investor to boost their share purchase by $250,000 while still leaving cash in their sweep account.
It's important to note a few things. The Federal Reserve Board's Regulation T limits the broker to lending up to 50% of the initial investment. This puts a hard cap on how much margin the investor can borrow. Second, many brokerage houses have their own regulations that may be more stringent than Regulation T.
This, of course, is all fine and good if the stock goes up. Using leverage (or gearing as they call it in the UK and Australia), investors can make more profits than they could have if they only used their own cash. But what if the stock goes down? If that's the case, then the investor's losses would be much more significant than if they only used their own cash. One of the worst possible scenarios is when the stock price drops so low, the brokerage company makes a "margin call," essentially demanding the investor pay back some - or all - of the total amount of margin borrowed. Margin calls can force investors to sell other assets to raise cash at precisely the wrong time, wiping out gains or even bankrupting them. As usual, there is no free lunch, and increased returns always come with higher risk. At Nintai, we have an official policy that bans the use of leverage - or margin - in both individually managed as well as our internal fund.
So why bring up margin loans/debt at this point in the market cycle? The major indexes are near all-time highs, and the economy is slowly recovering from the COVID crisis. What's to worry about?
A Remarkable Twenty Year Run: 2000 - 2020
Below you will find a chart mapping two trends – the returns of the S&P 500 (the blue line centered on the right axis in terms of trading price) and the amount of margin debt (the red line centered on the left axis in billions of US dollars). The chart begins in 1997 because this was the year of the margin debt reporting changed dramatically. Before 1997, margin debt data was available for only the New York Stock Exchange (NYSE) members. Post-1997, the NYSE closed down its data collection and allowed the Financial Industry Regulatory Authority (FINRA) to capture data from all major exchanges such as NASDAQ and NYSE.
As you can see, 1997 represents the nearly three-quarter point in the 1982 - 2000 bull market that culminated in the great technology bubble. Margin debt peaked in 2000 before reaching its nadir in 2003. It wasn't long after getting this bottom that investors forgot any lessons related to the risk of margin and market bubbles by pumping up margin debt to all-new high highs in July 2007 - just in time for the collapse of the next market bubble (the Great Credit Crash) leading to stunning losses in individual brokerage accounts accelerated by this considerable margin debt. But like Sisyphus (who really should be Wall Street's patron saint), investors started the cycle all over again (the third time in just ten years!). With the new bull market beginning sometime in 2009, margin debt has grown hand in hand with growth in the S&P 500 average, with total margin debt rising from roughly $250B in 2009 to nearly $800B in 2020. After the market correction in early 2020, margin debt fell from $600B at the beginning of 2019 to $475B after the correction. After such a reduction, any pessimistic feelings were immediately forgotten when debt rose from $475B in early 2020 to nearly $800B (!) by the end of the year – a staggering 68% increase in just nine months.
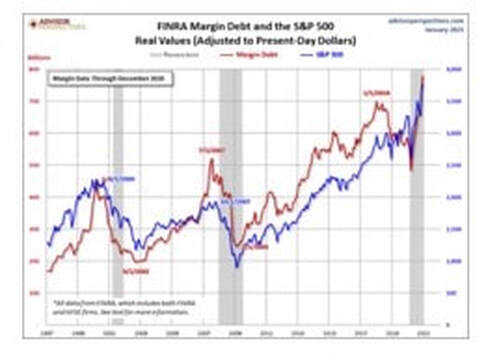
Source: "Margin Debt and the Market: Up 2.6% in January, Continues Record Trend", Jill Mislinski, February 18, 2021
If we zoom in further and look at the tail end of the chart data, you can see the remarkable increase in margin debt. FINRA (through Investopedia) stated[1]:
"Margin debt has reached the highest point in two years as investors borrowed a record $722.1 billion against their investment portfolios through November, topping the previous high of $668.9 billion from May 2018, according to the Financial Industry Regulatory Authority (FINRA). This amount is a 28% increase since the same time last year and is up nearly 10% from $659.3 billion in Oct. 2020".
This massive increase was likely driven by the markets' assumptions that vaccines would bring an end to COVID-19 as an economic story.
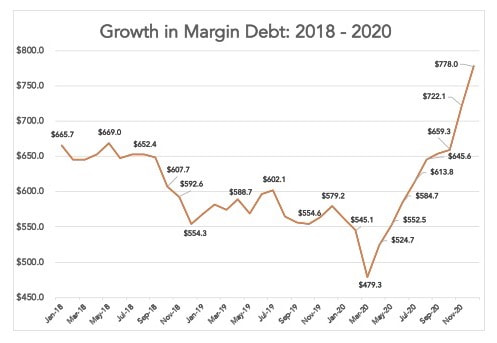
Source: FINRA, "Margin Statistics," January 2021
Why This Matters
Many readers may ask, "So what? The markets are going up. What's the big deal?". If markets continued to rise indefinitely, then the short answer would be there isn't much to worry about. But we all know markets don't go up indefinitely. An 11-year-old bull market will end. The question isn't if. The question is when?
Margin debt is no different from corporate debt, except that margin debt would be considered short-term debt at all times. The reason why Nintai Investments is so averse to debt is that it seems to come due at the most inopportune time. Most companies borrow money when they need it but have to pay it back when they need it even more. This doesn't make for the best capital allocation decisions.
Individual investors are no different than corporations when it comes to margin debt. Investors tap their margin credit lines when they want to purchase more shares and leverage their current assets. They need that credit even more, when markets crash and margin calls come flooding in. Much like the corporation, this doesn't lead to rational capital allocation decisions.
A Useful Example
Let's assume Bob is an investor who considers his stock-picking abilities above average and is tired of just barely meeting the index's returns (which, when you think of it, makes him just average, but will let that go for the sake of our case). Bob has $600,000 of equities in his taxable brokerage account and $200,000 in cash in the brokerage account's sweep account. He has decided to leverage these assets and begin trading on margin. A quick reminder: in Bob's brokerage account (or cash account), all transactions must be made with the cash on hand in the account. A margin account allows the investor to borrow against the total value of assets in the cash account. In Bob's case, his cash account would be worth $800,000 ($600,000 in equities and $200,000 in cash). According to Regulation T, Bob's brokerage house can loan him up to 50% of the total purchase price.
After considerable research, Bob has decided to purchase $250,000 of "Ted's Adventure Company" (note: this is a fictional corporation). When Bob purchases these shares on his margin account, he has one "payment period" (his brokerage account names this as five business days) to meet the Regulation T 50% margin requirement. Bob utilizes his cash and equities as collateral. He feels very comfortable knowing he has $800,000 in his cash account to post versus the $250,000 margin balance. Regulation T requires 50%, so Bob is required to cover $125,000 (which is 50% of 250,000 on margin).
So far, so good. Bob is in fine shape unless one of three things happen. First, a general market decline decreases the value of both the stocks he borrowed against (Ted's) to buy (remember: the $200,000 balance remains the same). If the stock drops by 25%, then Bob now needs to have enough capital to cover the $250,000 initial loan plus the 20% decrease in the value of his shares bought with the loan ($250,000 x 20% = $50,000) In this case his margin balance increases from $250,000 to $300,000. The second action that impacts his margin status is if the value of the stocks he holds in collateral decreases. For instance should Bob’s equities also decrease by 20%, then his balance available as collateral drops from $600,000 to $480,000 ($600,000 - 20% = $480,000). If Bob is near the 50% required collateral level, he may be required to post additional assets to keep below the 50% mark. This is known as a margin call. I'll get into more detail about that shortly. The third action that would affect Bob's margin status is if he finds himself in need of cash and has to tap the $200,000 in his sweep account. Again, this might bring him below the required 50% margin coverage.
Unfortunately, rarely does one of these things happen alone. During a market crash, the stock price (Ted's) is likely to drop in addition to the value of the equities in Bob's brokerage account. Additionally, he may need cash from the sweep account because the market crash has accompanied an economic downturn and Bob's planned bonus never appeared. This would be known (and I hate the term) as "the perfect storm" for Bob's portfolio.
The Margin Call
Now that we've walked through the logistics of using margin, let's look at the worst-case scenario when things go wrong – the dreaded margin call. A margin call happens when the amount of assets in the investor's margin account falls below the required amount. For instance, let's use the case of purchasing $250,000 of Ted's Adventure Co. Assuming our investor used $125,000 from their cash account and $125,000 from their margin account, they have barely met Regulation T that requires the amount of the margin purchase not to be more than 50% of the total price paid (Since the purchase was $250,000 in stock and the investor used $125,000 of their margin account, then just met Regulation T's 50% rule). Should the stock price start dropping, the brokerage house will begin the process of a margin call when the asset price falls below $125,000. For instance, should the stock drop 20%, then the stock's total value purchased on margin drops from $125,000 to $100,000. In this instance, the brokerage house would place a margin call for $25,000. This means the investor would need to place an additional $25,000 into the margin account. Since this event rarely happens in a vacuum, a margin call can put enormous strain on an investor. If the brokerage company doesn't receive its $25,000, it can liquidate other stocks - no matter the price - to meet the margin call. As I said, these events rarely happen in a vacuum, and the forced selling of additional prices likely will take place as those share prices are dropping as well. It's never good when you are forced to sell at any price. Particularly when the proceeds of any sale are needed to fill a gap caused by a margin call. When a margin call forces a sale, you can expect the prices your assets are sold will be to your disadvantage.
Final Thoughts on Margin Trading
As major indexes trade and margin debt both reach near all-time highs, any investor utilizing high amounts of leverage (margin debt) should consider the potential implications of a severe market drawdown. As I've explained earlier, generally, margin calls are part of an investor's perfect storm with the potential of causing catastrophic losses in their portfolios. Here are some thoughts I offer investors employing leverage in today's markets.
Leverage Goes Both Ways
For every person who uses margin to increase their profits, some investors increased their losses by utilizing leverage. After such a long period of market gains, it's easy to lose sight of the fact that markets can drop - and drop fast. Just ask anybody who was highly leveraged in the spring of 2020. With valuations as tight as they are, it shouldn't surprise anyone to see a 25 - 30% correction at any time. If you are using a model that uses a significant increase in market prices, build in such a loss. Then double it again. You might be surprised by the results.
Just Because You Can Doesn't Mean You Should
The recent events with RobinHood and GameStop (GME) trading have shown that not everybody should be trading on margin or shorting stocks. Just because an investor has access to margin accounts and trading doesn't mean they should employ such a strategy. Unless an investor has given considerable thought about the potential impact (and modeled possible results) of utilizing leverage, they should stay clear of any such market operations. Just because you have access to a margin account doesn't mean you should use it.
Enough Can Truly Be Enough
After a twelve-year bull market, if - as an investor - you don't feel you've squeezed out every possible profit from your investments, then margin isn't the way to go. It seems the odds (though I have no real way to predict) predict a much lower growth rate or even net negative returns over the next decade. If this proves to be accurate, then margin isn't going to help squeeze any extra returns out of the market at this point. We highly recommend investors recognize they've gotten as much as possible from this bull market and head for safer investment waters.
Conclusions
Just a few days ago, Charlie Munger commented on special purpose acquisition companies (SPACs),
"This kind of crazy speculation, in enterprises not even found or picked out yet, is a sign of an irritating bubble. The investment-banking profession will sell shit as long as shit can be sold."
We think the use of margin accounts and leverage are similar for individual investors. Wall Street sells margin accounts because they can. In most cases, they are inappropriate for investors and allow them to take on terrible risks while only thinking about possible rewards. There are many safer ways for investors to increase returns. These include cutting down on management fees and reducing trading costs. The actions minimize the risk while generally increasing returns. As an individual investor, at Nintai, we suggest investors look for the low-hanging fruit and safest ways to juice (no pun intended!) returns. We think this is the smartest move available to individual investors by a wide margin (pun intended).
-----------------------------------
[1] https://www.finra.org/investors/learn-to-invest/advanced-investing/margin-statistics

 RSS Feed