“We define an economic – or competitive – moat as the ability of a portfolio company to create a product or service that is essential to their customer’s strategy or operations. An example of this might be a platform that is essential to capture, analyze and report customer usage data. There are companies like this – Veeva being an example – that are essential to life sciences drug development, promotion, and sales. This in turn generates extraordinary return on capital. Over time, you end up with a holding that is an essential part of their customer’s business that generates extraordinary profits. What’s not to like?”
- Nintai Investments LLC
What Makes A Quality Investment?
Over the course of my investment career, I’ve invested in roughly 250 companies. Holding times have ranged from 6 months to 12 years. All of them have met certain criteria which I’ve written about over the years - high returns on capital, equity, assets, high free cash flow margins, and low to no debt. But there are intangible qualities to each of these companies that might create competitive advantages that can’t be simply quantified though a set of ratios.
Importance to Strategy and Operations
A key characteristic we look for at Nintai Investments is a company that produces products or services that are essential in assisting their customers carry out their strategies and operations. This might include everything from creative work (slogans, product jingoes) to building parts essential to making the product operate at peak efficiency. Simply put, their customers wouldn’t be nearly as successful without your portfolio company’s products and services.
Replacement Difficulty
Another sign of quality is the difficulty of a customer in finding a replacement for that specific portfolio holding. An example of this is Fastenal (FAST). The company maintains thousands of vending machines and local shops that supply parts nearly instantaneously keeping manufacturing floor downtime to a minimum. Most companies simply don’t have the scope of product to meet those needs.
Embedded Strength
Any company with a deep and wide moat should have relationship deeply embedded with their costumer’s senior management team. This means a strong web of corporate relationships, a deep sense of trust that the company can meet its promises and deliver product on time, and a long history of quality. These types of intangibles make it hard for any competitor to make inroads in terms of relationships with the customer.
Industrial Expertise
Finally, the portfolio holding should have both a wide and deep knowledge of the industry of their customers. The company should be able to brain storm with middle to senior executives on problem solving potential issues from customer needs to plant operations. This type of knowledge allows a portfolio holding to not only build on existing product lines but develop new solutions unheard or unthought of previously.
A Working Example
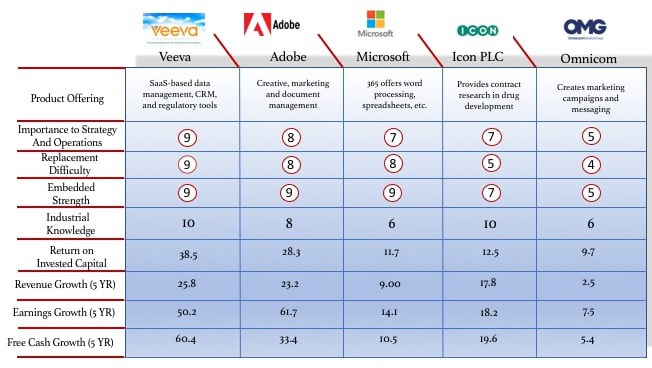
A working example of how Nintai Investments evaluates both existing and potential investment holdings was the purchase of Veeva (VEEV) and Adobe (ADBE) during the market drops in December 2018. Both companies have Pfizer (PFE) as customers and we decided to evaluate the two holdings versus three different vendors who also work with Pfizer - Microsoft (MSFT), ICON Plc (a contract research organization or CRO), and Omnicom (an advertising agency). In Figure 1 is the summary report of the five companies and their respective ratings.
This graphic is typical of the type of work that we generate during research at Nintai Investments LLC. It helps us understand where the strength – and weaknesses – lie with both a potential investment as well as other major vendors at key customers. The goal of course is to isolate the possible weaknesses in our investment case as well as test our knowledge of both a typical customer along with its market. We will generally test these graphics (and the associated ratings) with individuals in the customer we are evaluating (in this case Pfizer) as well as individuals we might know at the competitors listed.
- Nintai Investments LLC
What Makes A Quality Investment?
Over the course of my investment career, I’ve invested in roughly 250 companies. Holding times have ranged from 6 months to 12 years. All of them have met certain criteria which I’ve written about over the years - high returns on capital, equity, assets, high free cash flow margins, and low to no debt. But there are intangible qualities to each of these companies that might create competitive advantages that can’t be simply quantified though a set of ratios.
Importance to Strategy and Operations
A key characteristic we look for at Nintai Investments is a company that produces products or services that are essential in assisting their customers carry out their strategies and operations. This might include everything from creative work (slogans, product jingoes) to building parts essential to making the product operate at peak efficiency. Simply put, their customers wouldn’t be nearly as successful without your portfolio company’s products and services.
Replacement Difficulty
Another sign of quality is the difficulty of a customer in finding a replacement for that specific portfolio holding. An example of this is Fastenal (FAST). The company maintains thousands of vending machines and local shops that supply parts nearly instantaneously keeping manufacturing floor downtime to a minimum. Most companies simply don’t have the scope of product to meet those needs.
Embedded Strength
Any company with a deep and wide moat should have relationship deeply embedded with their costumer’s senior management team. This means a strong web of corporate relationships, a deep sense of trust that the company can meet its promises and deliver product on time, and a long history of quality. These types of intangibles make it hard for any competitor to make inroads in terms of relationships with the customer.
Industrial Expertise
Finally, the portfolio holding should have both a wide and deep knowledge of the industry of their customers. The company should be able to brain storm with middle to senior executives on problem solving potential issues from customer needs to plant operations. This type of knowledge allows a portfolio holding to not only build on existing product lines but develop new solutions unheard or unthought of previously.
A Working Example
A working example of how Nintai Investments evaluates both existing and potential investment holdings was the purchase of Veeva (VEEV) and Adobe (ADBE) during the market drops in December 2018. Both companies have Pfizer (PFE) as customers and we decided to evaluate the two holdings versus three different vendors who also work with Pfizer - Microsoft (MSFT), ICON Plc (a contract research organization or CRO), and Omnicom (an advertising agency). In Figure 1 is the summary report of the five companies and their respective ratings.
This graphic is typical of the type of work that we generate during research at Nintai Investments LLC. It helps us understand where the strength – and weaknesses – lie with both a potential investment as well as other major vendors at key customers. The goal of course is to isolate the possible weaknesses in our investment case as well as test our knowledge of both a typical customer along with its market. We will generally test these graphics (and the associated ratings) with individuals in the customer we are evaluating (in this case Pfizer) as well as individuals we might know at the competitors listed.
In May 2018, Nintai Investments LLC completed an in-depth survey with Pfizer’s middle and senior level executives to discuss the importance the company perceived in two of our portfolio holdings - Veeva (VEEV) and Adobe (ADBE). We then matched these with three other vendors working with Pfizer. The intention of the research was to measure the strength of the intangible qualities of the companies’ moats. In other words, did Veeva and Adobe have stronger (or said differently - “deeper”) roots into their customer Pfizer.
What We Found
Over time, Nintai Investments has spent an inordinate amount of time trying to better understand what makes a moat deeper, wider, and increasingly difficult to overcome. What we’ve come to think (and this in no way makes it true) is the previously mentioned intangibles - only found in deep industry and corporate knowledge - are the key components that drive long-term moat duration. Here’s why:
Depth of Relationship Increases Returns
As a portfolio holding company offers an increasing number of products and services, the company should increase returns over time (see “New Markets are Less Capital Intensive” for more thoughts on this). Done successfully, these products and services embed the portfolio company deeper and deeper into their customers’ operations. For instance, Veeva began by offering customer relationship management software for sales and promotion. The company spread its products and services into research site operations, clinical data management, clinical operations, regulatory requirements, etc. As the number of offerings increase, their strength is magnified by their integrative capabilities. At this point, Veeva is so deeply embedded in life sciences it would be extraordinarily difficult to displace them.
Industrial Knowledge Provides A Huge Edge
When a company like Veeva focuses on one particular market (in this case life sciences) and learns what makes the industry really tick (for instance reimbursement is more important that physician prescribing for some drug classes), a company can begin to really dominate a market and provide a great growth story. For instance, Veeva currently dominates Life Sciences CRM and has seen earnings growth of 50% and free cash flow growth of 60% over the past 5 years. Omnicom has no clear dominance in any market and has seen roughly 8% and 5% growth respectively over the same time period. Which company has a potentially greater growth story? Obviously nothing is written in stone, but my money currently is on Veeva.
New Markets are Less Capital Intensive
When an investor looks at a Veeva or Adobe, it becomes apparent their strategy is to move into adjacent industries where capital outlays are limited by the existence of current products and similarities between industries. For instance, Veeva’s move into cosmetics makes sense in the fact the industry faces very similar operations as life sciences - design and testing of human-usage products, federal regulatory requirements, product safety, etc. The ability to remain asset and capital light in its research and development, product manufacturing, etc. continues to push margins and returns on capital higher.
Conclusions
Finding an investment with high quality characteristics is both a numbers driven and industry/company specific process. Running a screen that gives you a list of companies with high returns on capital and equity, no debt, and high free cash flow margins is only 15 - 20% of the research process. The ability to define why and how a company achieves those numbers and how it can maintain them for the next two decades requires an enormous amount of contacts, industry journal reading, and interviews (both potential investment management, customers, industry leaders, etc.). At Nintai Investments, we believe we have enough knowledge in perhaps 50 - 75 companies and 2 - 3 industries to invest in over the next decade. Understanding the quality of those companies - both numbers wise and in a broader business sense can give you an edge that not many players on Wall Street can compete with over a 10 year period.
As always, I look forward to your thoughts and comments.
DISCOSURES: Nintai Investments owns positions in Veeva and Adobe in individual privately managed accounts.
 RSS Feed