NINTAI INVESTMENTS
  • About
  • Nintai Insights
  • Recommended Reading
  • Contact
  • Performance
  • Client Forms

pharmaceuticals as the new bonds

8/30/2016

0 Comments

 
Unless you become more watchful in your states and check the spirit of monopoly and thirst for exclusive privileges you will in the end find that... the control over your dearest interests has passed into the hands of these corporations”.
                                                                              - Andrew Jackson

“We don't have a monopoly. We have market share. There's a difference.”
                                                                             
​                                                                              - Steve Ballmer

A lot has been written about biopharma and drug prices in the United States. I’d like to suggest a new way of thinking about the pharmaceutical industry. Think of the largest pharmaceutical companies as a medium risk/medium reward bond. (Not literally. This is a concept only!). I suggest this for three reasons - pharmaceitical dividends, record low interest rates and pharmaceutical drug pricing.

First, pharmaceuticals have a long history of generous and increasing dividends. As I will discuss further on in the article, most of the largest pharmaceutical companies have shown steady growth in their dividend for the past 10 years, even in times of declining revenue.

The second started as the central banks of countries around the world have lowered their discount rates to the point that for the first time, we are seeing negative interest rates at a global level (excluding the US if Janet Yellen has her say). The impact of this is enormous. For net savers - individuals and pension funds alike – the need to stretch for yield becomes essential. Dividend paying stocks, along with utilities, have been some the best performing stocks in the US markets. As steady dividend payers, the largest pharmaceuticals represent a decent yield that far exceeds the interest rate on a 10-year Treasury note. Many will point out the risk relative to a pharmaceutical and the US treasury is quite wide. I would agree with this - to a certain extent. And this brings us to our third point - pharmaceutical drug pricing.
In this week’s Journal of the American Medical Association (JAMA), researchers from Brigham and Women’s Hospital and Harvard Medical School published an outstanding article on the core factors surrounding US drug prices[1]. In the article, the authors point out five major characteristics of US pharmaceutical drug prices.

US Drug Pricing is Unique in the World
The United States over the past 35 years has spent a great deal more on drugs than the rest of the world. For instance, in 2013, per capita spending on prescription drugs was $858 compared with an average of $400 for 19 advanced industrialized nations. The spread is even greater for the true blockbuster drugs (meaning revenue of greater than $1 billion). For the top 20 drugs, prices were roughly 3 times greater in the US than in Great Britain. Even taking into account rebates (discounts that are negotiated between the pharmaceutical and payers such as Medicare, Medicaid and private insurers such as Anthem or United Health), drugs generally cost 10-15% more than Canada, France or Germany. Those blockbusters we just mentioned? Sometimes 150-200% more. Our business model in the US is simply unique.

Patents and Pay-for-Play Cause Government Created Monopolies
Under US law, pharmaceutical companies are granted patents for 20 years (or more), guaranteeing exclusivity for their drug. This can be somewhat offset by competitive offerings (think Sprycel versus Gleevac) that allow payers to play each pharmaceutical against their competitor. Pharmaceutical companies will look to extend patents by obtaining an extension through patenting the coating, or even the color, of the pill. But many therapeutic diseases (known as orphan diseases) have only one treatment option. In these cases, many pharmaceuticals will create a pay-for-play scenario with a would-be generic drug manufacturer. In these cases, the pharmaceutical will reach an agreement with the generic company to not produce a generic version. Why does this matter? In most cases, the generic version of a drug is 55-75% below the branded drug.

FDA Approvals Are Just as Hard on Generics
Each pharmaceutical drug approved by the FDA goes though an extensive clinical trial process to show efficacy, safety and delivery methods. This process can take as long as seven years. For generics, the FDA plays by the same rules, though you would think an exact replica of the branded drug would be much quicker. There you would be wrong. The average approval process for a generic is 3 to 4 years. This time frame essentially extends the pharmaceutical’s opportunity for this additional period. No generic means no price reduction.

Rules and Litigation Can Drive Up Costs
A lot of money could be saved when a patient goes to the pharmacy to fill a prescription. If a generic is available (remember: these are FDA approved replacements), then the pharmacist could switch from a branded heart medicine to its generic version. Not so fast, 26 states require the pharmacy get a written consent to make the switch. The cost? The aforementioned heart medicine (in this case Zocor) cost Medicare nearly $20 billion in in 2006 simply because pharmacies could not get patient consents.

Drug Pricing is Based on Competition, Not R&D Costs
You will often hear the pharmaceutical industry trade group PhRMA talk about the costs of R&D driving the ultimate costs of their members’ product. And there is some truth in this. It is extraordinarily expensive to bring a drug to market. Estimates range from $880 million to $1.4 billion. Not chump change. But products are priced mainly on two things – what your competition charges and/or what the market will bear. We are learning there are limits to the latter. Gilead’s pricing for its hepatitis C therapies drew a withering response from payers. Open the paper on almost any given day and you can read about some supposed outrage being perpetrated against patients.

So What Does This Mean?
To get back to my thesis of seeing large pharmaceuticals as a substitute for bonds, the following are my reasons for proposing such an idea.
​
Growth Has Been Slow….But Steady
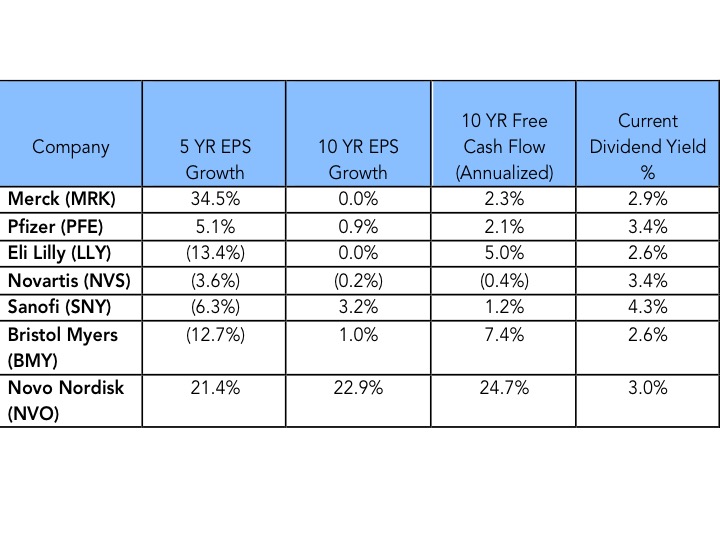
When you take a look at large pharmaceuticals over the past 5 and 10 years, several things stick out. First, the last 10 years have been the most difficult for these companies in the past half century. The low hanging molecules have gone off patent and many companies are just now getting back to growth. This can be seen in both the 5 and 10 year EPS growth rates. But quite amazingly, only one company has seen free cash flow decrease over the past 10 years. While markets were difficult, large pharmaceuticals, through a combination of cost savings and annual price increases, continued to slowly grow free cash flow over the past decade. This has meant that every one of these companies has increased their dividend over the past 10 years[2].
Picture
The Business Model Is Unlikely to Change
For the reasons cited in the JAMA article, the ability of large pharmaceuticals to drive revenue and dividend growth has all the makings of an extraordinarily wide moat. With so much dependent on Congressional legislation, it is unlikely these factors will change much at all (or any) over the next decade. Pressure from payers will likely hold prices down somewhat, but overall increases are baked into their fee structure models.

A New Stage of Growth Has Arrived
Areas of growth have emerged for large pharmaceutical companies such as onco-immunology, diabetes, hepatitis and vaccines. These therapeutic classes not only have high growth rates (from 2016-2022 annual growth rates are estimated to be 9%, 8%, 6% and 5% respectively). This type of growth will likely prove to be significant drivers for revenue and dividend increases over the next decade.
​
Conclusions
Faced with a historically low interest rate environment, savers are faced with the possibility of paying the government to hold their cash. This is obviously not a wise course of action for pension plans or individual retirees faced with growing cash needs. By changing the lens slightly, it’s possible to see how large pharmaceuticals could provide the opportunity to replace government bonds with an “equity bond” that yields far more and provides a great deal of safety of their principal. Note, I say a great deal. There is really no way to reduce the risk of a publicly traded equity to the level of a government bond. But extreme environments demand innovative thinking. For those faced with record low yields, this might be a risk worth taking.

Disclosure: Both the Nintai Charitable Trust and some individual accounts at Dorfman Value Investments own shares in Novo Nordisk (NYSE:NVO)
0 Comments

costs as a predictive tool

8/13/2016

0 Comments

 
​“If “active” and “passive” management styles are defined in sensible ways, it must be the case that (1) before costs, the return on the average actively managed dollar will equal the return on the average passively managed dollar and (2) after costs, the return on the average actively managed dollar will be less than the return on the average passively managed dollar. These assertions will hold for any time period. Moreover, they depend only on the laws of addition, subtraction, multiplication and division. Nothing else is required”[1] .

                                                                                -    William Sharpe

For those who follow my writing, you know that management fees, trading expenses, and turnover are subjects that I feel strongly about. Time after time it has been proven that higher fees mean lower returns for investors. It makes sense. As Jack Bogle so eloquently states the average investor’s return must be stock market return less expenses. The lower the expenses the greater the return. 

A recent follow-up study on fees versus returns by Morningstar[2] looks at fund expense ratios as a predictive tool for mutual fund returns. The study looked to evaluate the success ratio of funds over the past five years. This ratio was an answer to the question of what funds both survived and outperformed their category group. In researching this the Morningstar team evaluated the following data: total return over the ensuing period, load-adjusted returns, standard deviation, investor returns, and the subsequent Morningstar Rating. 

The report findings further bolstered the argument that fees are the greatest predictor of fund performance. From 2010-2015, the cheapest quintile of all US equity funds had a total return success rate of 62% compared with 48% for the second-cheapest quintile, then 39% for the middle quintile, 30% for the second-priciest quintile, and 20% for the priciest quintile. The cheaper the quintile the better your chances. All told, cheapest-quintile funds were 3 times as likely to succeed as the priciest quintile. You see this in almost every category. International equity funds had a 51% success ratio for the cheapest quintile compared with 21% for priciest. Balanced funds had a 54% success rate for the cheapest quintile compared with 24% for the priciest. Taxable-bond funds had the widest gap as the cheapest quintile delivered a 59% success rate versus just 17% for the priciest quintile. Muni bonds had a similar pattern, with a 56% success rate for the cheapest quintile and 16% for the priciest. There are always exceptions. For instance, Artisan International (ARTIX) has significantly outperformed its bogey (MSCI ACWI) since 2010 while charging an above average 1.19% management fee. 

Occasionally you will see an outlier – that against all reason or experience – continues to stay in business with the most shocking fees combined with remarkable underperformance. These are funds that aren’t just in the top quintile for expenses but in the top 1%. An example of this is the Pacific Advisors Mid Cap Value Fund (PAMVX). This is a fund that stands as a monument to the marketing prowess of some investment professionals. How any investor would stay invested in this fund (along with the other four Pacific Advisors funds) boggles the mind. 

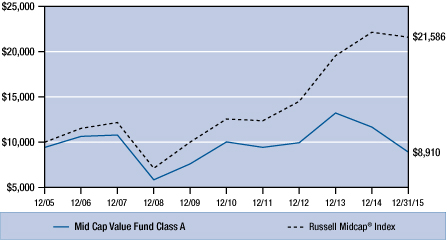
Let’s start with a hypothetical $10,000 investment in the fund starting in December, 2005. Ten years later you would have exactly $8,910. Compare this to the Russell Midcap Index’s value of $21,586 over the same period. If Morningstar’s study predicts the lowest returns for the most expensive funds then surely we couldn’t find a better example.  
Picture
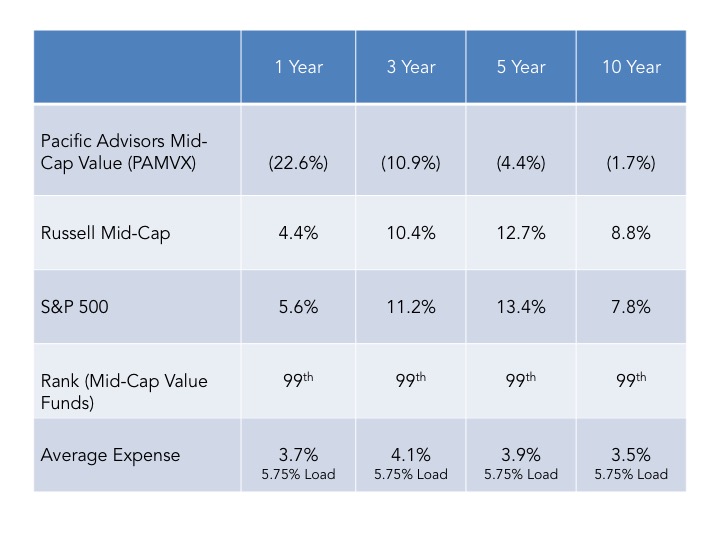
​What could possibly drive such underperformance? First are the funds fees. 2015’s management fee rolled in around 3.7%. Combine this with a 5.75% load and you can see it would be nearly impossible to beat any index with such a burden. Second is the simply horrible returns generated by the investment team. For a team to generate an average annual return of -1.7% over the last ten year period is quite a feat. When one compares the 1, 3, 5 and 10 year returns versus the Russell Midcap Index and the S&P 500 Index, the funds performance is simply astounding.  For each period the fund ranks in the 99th percentile in their performance versus the Midcap index (Note: in Morningstar’s ranking system, the first percentile is the best and the 99th the worst). 
Picture
​Not surprisingly, the Pacific Advisors Mid-Cap Value fund is down to roughly $5M in assets under management. Surprisingly, some of their funds still have assets under management of greater than $25M[3]. Fees and performance are quite similar to the Mid-Cap Value fund. Each fund ranks in 99th percentile in their category over a 1, 3, 5, and 10 year period.
 
The case of Pacific Advisors may be extreme, but the funds’ fees versus returns further supports Morningstar’s contention that the higher the fees the lower the returns. Investors should always be on the lookout on how to reduce costs. Whether it’s through rapid trading, management fees, or brokerage fees, every cost comes out of your returns.
 
One last note. Pacific Advisors has several documents for investors. One of them is entitled “The Power of Compounding”. It starts by stating,
 
“When it comes to saving and investing, time really is on your side. Long-term investing can provide returns that significantly outpace inflation when you put the power of compounding interest to work for you”.
 
What they don’t state is the exact opposite is true. Illustrating what Jack Bogle calls “the tyranny of costs”, high fees eat at your performance on a compounding rate as well. For funds with outrageous fees, time is clearly not on your side. For a fund that has returned -1.7% annually over the past 10 years, perhaps Pacific Advisors should amend their documents to reflect reality versus the hypothetical. Their investors deserve nothing less.
 
[1] “The Arithmetic of Active Management” William Sharpe, Financial Analysts Journal, January/February, 1991
[2] “Predictive Power of Fees: Why Mutual Fund Fees Are So Important”, Morningstar Manager Research, May, 2016
[3] Large Cap Value (PAGTX) $7.6M AUM, Small Cap Value (PASMX) $27.8M AUM, Income & Equity (PADIX) $16.4M AUM, and Balanced (PAABX) $6.2M AUM. 
0 Comments

thoughts on return on capital versus return of capital

8/2/2016

0 Comments

 
I am frequently asked about whether I prefer return on capital versus return of capital in my investments. My initial answer to this question is usually “it depends”, but my genetic makeup of sloth and indolence generally lead me to favor allowing management to generate return on capital versus making me find great opportunities by the return of capital. As Edgar Bergen (and Warren Buffett) so aptly said, “Hard work never killed anyone, but why take the risk”.

Before making any decisions on which return is better for investors, it would be wise to take a look at some relevant facts. First, some definitions. Return on capital measures the return that an investment generates for capital contributors. It indicates how effective a company is at turning capital into profits. Return of capital (and here I differ with some definitions) is when an investor receives a portion of his original investment back - including dividends or income - from the investment.
​Last year, Michael Mauboussin published an interesting update on management skills in capital allocation[1]. Some of the data mentioned in the article directly impact our evaluation.
  1. Internal financing represented more than 90% of the source of total capital for U.S. companies from 1980-2014. This is a higher percentage than that of other developed countries including the United Kingdom, Germany, France and Japan.
  2. Mergers and acquisitions (M&A), capital expenditures and research and development (R&D) are the largest uses of capital for operations. In the past 35 years, capital expenditures are down - and R&D is up - as a percentage of sales. This reflects a shift in the underlying economy. M&A is the largest use of capital, but follows the stock market closely. More deals happen when the stock market is up.
  3. The amount companies have spent on buybacks has exceeded dividends for the past decade, except for 2009. Buybacks only became relevant in the U.S. starting in 1982. Any use of earlier data makes it difficult to compare apples to apples. The amount of payout has remained nearly the same, but the form of such payout has moved away from dividends and towards stock buybacks.
  4. After ten years on the job, a CEO whose company annually retains earnings equal to 10% of net worth will have been responsible for the deployment of more than 60% of all the capital at work in the business (as cited by Warren Buffett).
There are arguments for and against whether an investor should seek return on capital or return of capital. The answer you choose can make a huge impact on your long-term returns. But in either case, it requires finding individuals (either management of portfolio holdings or yourself as an investor) who are outstanding allocators of capital.
The argument for return of capital was most strongly made by the late great Peter Bernstein. In a fantastic October 2004 interview[2] with Jason Zweig, he went so far as to say that management should have no role in allocation of capital. He advocated that 100% of all net income be sent to shareholders directly – a rather extreme version of return of capital. In the interview Bernstein said:
“In the 1960s, in "A Modest Proposal," I suggested that companies should be required to pay out 100% of their net income as cash dividends. If companies needed money to reinvest in their operations, then they would have to get investors to buy new offerings of stock. Investors would do that only if they were happy both with the dividends they had received and the future prospects of the company. Markets as a whole know more than any individual or group of individuals. So the best way to allocate capital is to let the market do it, rather than the management of each company. The reinvestment of profits has to be submitted to the test of the marketplace if you want it to be done right”.
On the other side of the argument - in favor of return on capital - is the idea that a business that generates high returns on deployed capital should not return ANY of it to shareholders. Like the inevitable snowball analogy of increasing size over time, businesses that can maintain high ROC over an extended period of time need little or no effort from shareholders other than to step aside and let management do its magic.
A Working Example: Computer Programs and Systems (CPSI)
Taking this from a rather esoteric discussion to a more concrete one, I thought I would use a current Nintai Charitable Trust holding as an example – Computer Programs and Systems. The company has a stellar 10 year record of 38.5% ROE, 29.3% ROA and 58.4% ROC. What’s not to like? Well, a lot actually. Without a doubt, CPSI has been a truly epic mistake in my investment career. Another can be found here. Nothing sickens us at the Nintai Charitable Trust more than an unforced error like our investment in CPSI. We bought at exactly the wrong time - purchasing shares in December 2014 at $58.91 -bjust as the market for rural based electronic health record hospital systems peaked. But we compounded this error by purchasing more in February 2015 at $47.76 and then - in an act of true folly - made one more purchase in August 2015 for $45.75 per share. Shares are currently trading at $40.68 per share. Ouch.
There were reasons, of course, for making these purchases. Or at least, that is what we say to make ourselves feel better. Theoretically, CPSI’s push into services and data management should provide the company with a long and profitable runway. The operative word being “should”. Time will tell whether our thesis plays out over the long term.
I spent roughly $400,000 of the Trust’s capital to accumulate 7,350 shares in CPSI. Those shares are now worth roughly $300,000. This roughly 25% negative return on capital has been offset by a relatively generous return of capital of roughly $26,300 in the form of dividends. This reduces our loss (not for tax purposes, alas) from 25% to roughly 18% since we purchased these shares. In the long term, if the company continues to yield roughly 6% annually (and that is a big if) my yield to cost will work its way to zero. Meaning, I will have been paid back my initial investment by return of capital alone.
So Which Is It: Return OF or Return ON?
The measure of whether an investor should focus on return on capital versus return of capital really depends on what rate of return management can make versus the company’s average weighted cost of capital (AWCC). For a company that achieves 50% ROC versus an AWCC of 7.5%, the answer is clear – let management keep doing their job and – as Greg Allman said so wisely – “move away slowly”. Things get harder as ROC goes down and AWCC goes up. At the Nintai Charitable Trust we use general guidelines for when we want to see return on capital turn into return of capital.
                      Return on Capital >4 times WACC = No return of capital
              Return on Capital >2 but <4 times WACC = Some return of capital
                        Return on Capital <2 times WACC = Do not invest
These are guidelines only. Occasionally holdings may violate these for a short period during recessions or a retooling of strategy/products and we are fine with that in the short term. In the case of CPSI, we think we have the best of both worlds. After the integration of the Healthland, we think margins, profitability, and growth will return to more historic rates. Until then, return of capital reduces our cost average and allows us to deploy capital at higher rates for the moment.
Conclusions
The debate between return on capital versus return of capital really depends on two items – the results of how management deploys capital and the investor’s needs/use of returned capital. For management that generates significant returns on capital, then by all means let them do their job. For management that cannot find opportunities to produce returns significantly greater than their weighted average cost of capital, then investors should look to see returns in the form dividends or stock buybacks. While there is no cut and dry answer, the question of return on capital versus return of capital is driven by your investment’s skill in capital allocation and your individual investment strategy.

[1] “Capital Allocation – Updated Evidence, Analytical Methods, and Assessment Guidance”, Michael Mauboussin & Dan Callahan, June 2, 2015
[2] The full interview can be found here: http://money.cnn.com/2004/10/11/markets/benstein_bonus_0411/index.htm
0 Comments

    Author

    Mr. Macpherson is the Chief Investment Officer and Managing Director of Nintai Investments LLC. 

    Archives

    February 2023
    January 2023
    December 2022
    November 2022
    October 2022
    September 2022
    August 2022
    July 2022
    June 2022
    May 2022
    April 2022
    March 2022
    December 2021
    October 2021
    August 2021
    July 2021
    June 2021
    May 2021
    April 2021
    March 2021
    February 2021
    January 2021
    December 2020
    October 2020
    September 2020
    August 2020
    July 2020
    June 2020
    May 2020
    April 2020
    March 2020
    February 2020
    January 2020
    December 2019
    November 2019
    September 2019
    August 2019
    July 2019
    June 2019
    May 2019
    April 2019
    March 2019
    January 2019
    December 2018
    November 2018
    October 2018
    September 2018
    July 2018
    June 2018
    May 2018
    March 2018
    February 2018
    December 2017
    September 2017
    August 2017
    June 2017
    May 2017
    April 2017
    March 2017
    January 2017
    December 2016
    November 2016
    October 2016
    August 2016
    July 2016
    June 2016
    May 2016
    April 2016
    March 2016
    February 2016
    January 2016
    December 2015
    November 2015
    October 2015
    September 2015
    August 2015
    July 2015
    June 2015
    May 2015
    April 2015
    March 2015
    February 2015
    January 2015
    December 2014

    Categories

    All

    RSS Feed

Proudly powered by Weebly