“If “active” and “passive” management styles are defined in sensible ways, it must be the case that (1) before costs, the return on the average actively managed dollar will equal the return on the average passively managed dollar and (2) after costs, the return on the average actively managed dollar will be less than the return on the average passively managed dollar. These assertions will hold for any time period. Moreover, they depend only on the laws of addition, subtraction, multiplication and division. Nothing else is required”[1] .
- William Sharpe
For those who follow my writing, you know that management fees, trading expenses, and turnover are subjects that I feel strongly about. Time after time it has been proven that higher fees mean lower returns for investors. It makes sense. As Jack Bogle so eloquently states the average investor’s return must be stock market return less expenses. The lower the expenses the greater the return.
A recent follow-up study on fees versus returns by Morningstar[2] looks at fund expense ratios as a predictive tool for mutual fund returns. The study looked to evaluate the success ratio of funds over the past five years. This ratio was an answer to the question of what funds both survived and outperformed their category group. In researching this the Morningstar team evaluated the following data: total return over the ensuing period, load-adjusted returns, standard deviation, investor returns, and the subsequent Morningstar Rating.
The report findings further bolstered the argument that fees are the greatest predictor of fund performance. From 2010-2015, the cheapest quintile of all US equity funds had a total return success rate of 62% compared with 48% for the second-cheapest quintile, then 39% for the middle quintile, 30% for the second-priciest quintile, and 20% for the priciest quintile. The cheaper the quintile the better your chances. All told, cheapest-quintile funds were 3 times as likely to succeed as the priciest quintile. You see this in almost every category. International equity funds had a 51% success ratio for the cheapest quintile compared with 21% for priciest. Balanced funds had a 54% success rate for the cheapest quintile compared with 24% for the priciest. Taxable-bond funds had the widest gap as the cheapest quintile delivered a 59% success rate versus just 17% for the priciest quintile. Muni bonds had a similar pattern, with a 56% success rate for the cheapest quintile and 16% for the priciest. There are always exceptions. For instance, Artisan International (ARTIX) has significantly outperformed its bogey (MSCI ACWI) since 2010 while charging an above average 1.19% management fee.
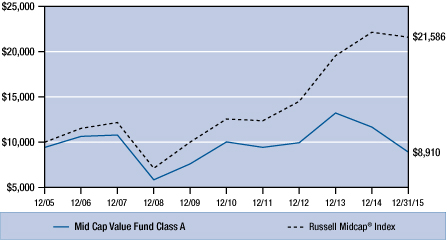
Occasionally you will see an outlier – that against all reason or experience – continues to stay in business with the most shocking fees combined with remarkable underperformance. These are funds that aren’t just in the top quintile for expenses but in the top 1%. An example of this is the Pacific Advisors Mid Cap Value Fund (PAMVX). This is a fund that stands as a monument to the marketing prowess of some investment professionals. How any investor would stay invested in this fund (along with the other four Pacific Advisors funds) boggles the mind.
Let’s start with a hypothetical $10,000 investment in the fund starting in December, 2005. Ten years later you would have exactly $8,910. Compare this to the Russell Midcap Index’s value of $21,586 over the same period. If Morningstar’s study predicts the lowest returns for the most expensive funds then surely we couldn’t find a better example.
- William Sharpe
For those who follow my writing, you know that management fees, trading expenses, and turnover are subjects that I feel strongly about. Time after time it has been proven that higher fees mean lower returns for investors. It makes sense. As Jack Bogle so eloquently states the average investor’s return must be stock market return less expenses. The lower the expenses the greater the return.
A recent follow-up study on fees versus returns by Morningstar[2] looks at fund expense ratios as a predictive tool for mutual fund returns. The study looked to evaluate the success ratio of funds over the past five years. This ratio was an answer to the question of what funds both survived and outperformed their category group. In researching this the Morningstar team evaluated the following data: total return over the ensuing period, load-adjusted returns, standard deviation, investor returns, and the subsequent Morningstar Rating.
The report findings further bolstered the argument that fees are the greatest predictor of fund performance. From 2010-2015, the cheapest quintile of all US equity funds had a total return success rate of 62% compared with 48% for the second-cheapest quintile, then 39% for the middle quintile, 30% for the second-priciest quintile, and 20% for the priciest quintile. The cheaper the quintile the better your chances. All told, cheapest-quintile funds were 3 times as likely to succeed as the priciest quintile. You see this in almost every category. International equity funds had a 51% success ratio for the cheapest quintile compared with 21% for priciest. Balanced funds had a 54% success rate for the cheapest quintile compared with 24% for the priciest. Taxable-bond funds had the widest gap as the cheapest quintile delivered a 59% success rate versus just 17% for the priciest quintile. Muni bonds had a similar pattern, with a 56% success rate for the cheapest quintile and 16% for the priciest. There are always exceptions. For instance, Artisan International (ARTIX) has significantly outperformed its bogey (MSCI ACWI) since 2010 while charging an above average 1.19% management fee.
Occasionally you will see an outlier – that against all reason or experience – continues to stay in business with the most shocking fees combined with remarkable underperformance. These are funds that aren’t just in the top quintile for expenses but in the top 1%. An example of this is the Pacific Advisors Mid Cap Value Fund (PAMVX). This is a fund that stands as a monument to the marketing prowess of some investment professionals. How any investor would stay invested in this fund (along with the other four Pacific Advisors funds) boggles the mind.
Let’s start with a hypothetical $10,000 investment in the fund starting in December, 2005. Ten years later you would have exactly $8,910. Compare this to the Russell Midcap Index’s value of $21,586 over the same period. If Morningstar’s study predicts the lowest returns for the most expensive funds then surely we couldn’t find a better example.
What could possibly drive such underperformance? First are the funds fees. 2015’s management fee rolled in around 3.7%. Combine this with a 5.75% load and you can see it would be nearly impossible to beat any index with such a burden. Second is the simply horrible returns generated by the investment team. For a team to generate an average annual return of -1.7% over the last ten year period is quite a feat. When one compares the 1, 3, 5 and 10 year returns versus the Russell Midcap Index and the S&P 500 Index, the funds performance is simply astounding. For each period the fund ranks in the 99th percentile in their performance versus the Midcap index (Note: in Morningstar’s ranking system, the first percentile is the best and the 99th the worst).
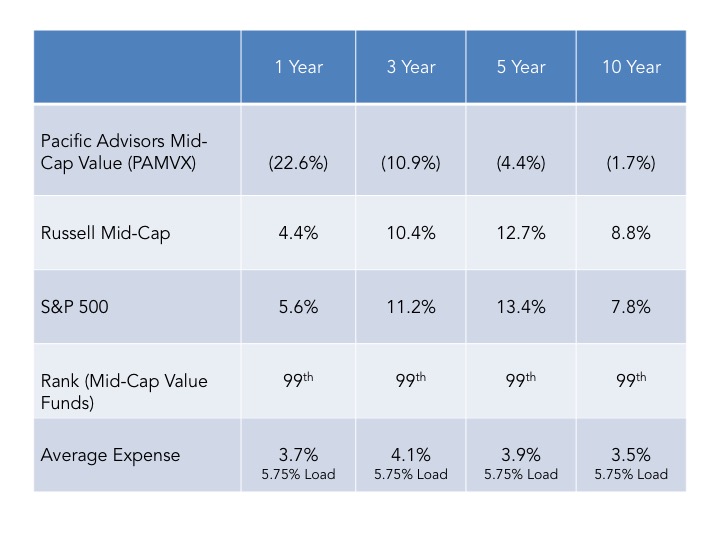
Not surprisingly, the Pacific Advisors Mid-Cap Value fund is down to roughly $5M in assets under management. Surprisingly, some of their funds still have assets under management of greater than $25M[3]. Fees and performance are quite similar to the Mid-Cap Value fund. Each fund ranks in 99th percentile in their category over a 1, 3, 5, and 10 year period.
The case of Pacific Advisors may be extreme, but the funds’ fees versus returns further supports Morningstar’s contention that the higher the fees the lower the returns. Investors should always be on the lookout on how to reduce costs. Whether it’s through rapid trading, management fees, or brokerage fees, every cost comes out of your returns.
One last note. Pacific Advisors has several documents for investors. One of them is entitled “The Power of Compounding”. It starts by stating,
“When it comes to saving and investing, time really is on your side. Long-term investing can provide returns that significantly outpace inflation when you put the power of compounding interest to work for you”.
What they don’t state is the exact opposite is true. Illustrating what Jack Bogle calls “the tyranny of costs”, high fees eat at your performance on a compounding rate as well. For funds with outrageous fees, time is clearly not on your side. For a fund that has returned -1.7% annually over the past 10 years, perhaps Pacific Advisors should amend their documents to reflect reality versus the hypothetical. Their investors deserve nothing less.
[1] “The Arithmetic of Active Management” William Sharpe, Financial Analysts Journal, January/February, 1991
[2] “Predictive Power of Fees: Why Mutual Fund Fees Are So Important”, Morningstar Manager Research, May, 2016
[3] Large Cap Value (PAGTX) $7.6M AUM, Small Cap Value (PASMX) $27.8M AUM, Income & Equity (PADIX) $16.4M AUM, and Balanced (PAABX) $6.2M AUM.
 RSS Feed