"The huge volatility of the market broke down all but the most fundamental relationships between markets and securities. The usual day-to-day world where investors cared about subtleties like corporate earnings or analysts’ forecasts dissolved as the energy of the market was turned up. All stocks moved together; if it was a stock, it was sold like it was plasma physics: as matter becomes hotter, it becomes less differentiated. The forces that bond atoms together in the form of molecules are overwhelmed, so that rather than having a myriad of different substances, we have the elemental building blocks of the atoms. Turn up the heat even more and the atoms themselves are melded into plasma, positively charged ions and negatively charged free electrons; matter in its most uniform and non-differentiated state, no longer hydrogen atoms and oxygen atoms, just a seething white-hot blur of matter.”
- Richard Bookstaber, “A Demon of Our Own Design”
During times of crisis, it’s often said that multiple correlations all converge at 1 as panic settles in – REIT owners, preferred stock owners, and even bond owners all look at their assets through identical lenses. As fear grows increasingly into panic, investors begin to see the heat rise even further into that “seething white-hot blur of matter” that Bookstaber discusses. Soon all assets – bonds, stocks, even derivatives – begin to narrow their correlation until it that trade near 1.
Morningstar just published a great article on why correlations tighten until they hit 1 during market corrections[1]. It’s important to remember that not every downturn in the markets drives correlations to near equal status. During the 1998 Asian currency crisis, all the categories of US diversified stock funds losses ranged from 1.7% to 22.6%. Not even close to a tight correlation. However, the coronavirus has induced a level of panic in the markets that selling (and buying) have pushed correlations the closest to 1 since the great recession.
So what makes this latest crash so intriguing? First, when Morningstar looked at all nine categories of UD diversified stock funds, the range in average losses was incredibly narrow and small – ranging from 10.8% and 11.6% starting from Feb. 19 - the S&P 500 high - and Feb. 27. Historically, this is a remarkably small range. What makes the small range so interesting, is the data show it to exist in nearly every respective type of fund. The most interesting to us at Nintai - and likely everyone at GuruFocus - is the difference between growth and value. It’s been a near given mantra that value will outperform growth during downdrafts in the market. So how did value do against the market in the initial period of collapse from February 19 - February 27?
It turns out during the virus-induced crash, there was very little difference between value and growth performance. During the period, value funds on average posted losses of 11.25% versus an 11.11% average drop for growth funds. The second category that Morningstar looked at was the difference between small-caps and large-caps. Again the difference was minimal between the two – small-caps posted a negative return of 10.94% versus a large-cap return of a negative 11.30%.
Of course, the S&P 5000 has dropped roughly 32% since its peak in February. Have the numbers changed any as the losses have increased? The initial review of the data suggest not. Value funds have lost roughly 31.6% since market highs while growth funds have lost roughly 33.2% during the same time. At its most basic, this market crash - driven by a virus of unknown nature, pathology, and treatment - has driven correlations to 1 from the onset of the disease/crash to its current state.
What Does All This Mean?
All of this has left us with some heady questions between the cause of the crash, the impact of the disease, and potential length and depth of the market crash. Here are some of the theories we are working on to think ahead for the next emergency similar to this one.
1. Stock Prices Were Inflated
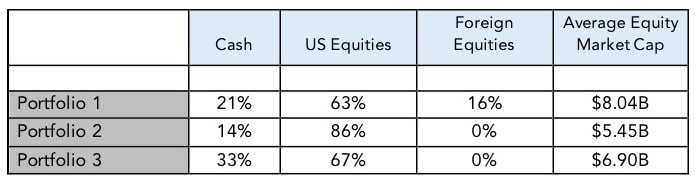
I’m not sure of many on Wall Street that wouldn’t have argued that stocks were due for a tumble some point. Record high P/E ratios, a 10 year bull market, and slowing growth all gave off the feeling that the bull market was nearing its end. At Nintai we had reached nearly 30% cash in some portfolios being unable to find anything that met our criteria or margin of safety. With the rebound in prices over the past few days, most buying opportunities have passed by already.
Greater Fear (As per VIX) Leads to More 1-Based Correlation
During the crash of February and March 2019, the VIX reached its highest level since the Great Recession. When the VIX reaches such stratospheric levels (66.2 in December 2008 and 65.65 on March 27 2020) nearly every asset is correlated. In other words, there are very few places to hide when the vast majority of investors are convinced the markets will drop.
Non-Controllable Events Lead to More 1-Based Correlation
Fear can be generated by fear or uncertainty or both. In some economic situations fear can be driven by poor earnings results or missed expectations. Uncertainty can be caused by a simply non-measurable event – meaning there is no way to quantify both the odds of it happening and the scope of the event. Fear and uncertainty can be a deadly mix on wall street. When they say “Wall Street has to climb the wall of worry”, they aren’t kidding.
Conclusions
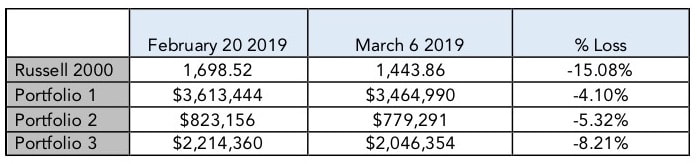
Over the course of the last month, several key learnings have come back to haunt investors. The first is that fear - real gut wrenching, visceral fear - forces a wide range of investors to act in a similar way. This can be value versus growth, small-cap versus large-cap, low-yield versus high-yield. When investors panic, the phrase “no place to hide” really means that many seemingly different asset classes suddenly all begin correlate to each other. Stocks, bonds, energy, utilities, REITs, etc. all begin to drop in similar ways and in similar amounts. In other words - the dreadful 1-factor correlation. The second learning is that crashes like we’ve seen over the past month are by far easiest ways to differentiate your returns (for both good and bad) against the general markets and individual investors. At Nintai Investments, we’ve seen our outperformance with the Russell 2000 jump from roughly 2 - 5% at the beginning of February to 20 – 25% by the end of March 2020[2]. Which brings us to the third finding. To give yourself a chance at outperformance, you really need to invest differently than the indexes and other investors. Whether it be 30% cash, 20% in microcaps, or investments in only 4 of the 11 S&P 500 industry categories (all characteristics of Nintai Investment portfolios), investors should find their niche and make it their own. Great value investors find their niche - purchase shares at a considerable discount to fair value – and hang on for the journey. The ability to differentiate your investment from the dreaded bear market 1 correlation will in the end decide how successful you are in the long term.
As always I look forward to your thoughts and comments.
DISCLOSURES: None
[1] “Correlations Going to 1: Amid Market Collapse, U.S. Stock Fund Fs Show Little Differentiation”, David Carey, Tom Lauricella, Mar 6, 2020
[2] Past investment performance does not ensure future returns
- Richard Bookstaber, “A Demon of Our Own Design”
During times of crisis, it’s often said that multiple correlations all converge at 1 as panic settles in – REIT owners, preferred stock owners, and even bond owners all look at their assets through identical lenses. As fear grows increasingly into panic, investors begin to see the heat rise even further into that “seething white-hot blur of matter” that Bookstaber discusses. Soon all assets – bonds, stocks, even derivatives – begin to narrow their correlation until it that trade near 1.
Morningstar just published a great article on why correlations tighten until they hit 1 during market corrections[1]. It’s important to remember that not every downturn in the markets drives correlations to near equal status. During the 1998 Asian currency crisis, all the categories of US diversified stock funds losses ranged from 1.7% to 22.6%. Not even close to a tight correlation. However, the coronavirus has induced a level of panic in the markets that selling (and buying) have pushed correlations the closest to 1 since the great recession.
So what makes this latest crash so intriguing? First, when Morningstar looked at all nine categories of UD diversified stock funds, the range in average losses was incredibly narrow and small – ranging from 10.8% and 11.6% starting from Feb. 19 - the S&P 500 high - and Feb. 27. Historically, this is a remarkably small range. What makes the small range so interesting, is the data show it to exist in nearly every respective type of fund. The most interesting to us at Nintai - and likely everyone at GuruFocus - is the difference between growth and value. It’s been a near given mantra that value will outperform growth during downdrafts in the market. So how did value do against the market in the initial period of collapse from February 19 - February 27?
It turns out during the virus-induced crash, there was very little difference between value and growth performance. During the period, value funds on average posted losses of 11.25% versus an 11.11% average drop for growth funds. The second category that Morningstar looked at was the difference between small-caps and large-caps. Again the difference was minimal between the two – small-caps posted a negative return of 10.94% versus a large-cap return of a negative 11.30%.
Of course, the S&P 5000 has dropped roughly 32% since its peak in February. Have the numbers changed any as the losses have increased? The initial review of the data suggest not. Value funds have lost roughly 31.6% since market highs while growth funds have lost roughly 33.2% during the same time. At its most basic, this market crash - driven by a virus of unknown nature, pathology, and treatment - has driven correlations to 1 from the onset of the disease/crash to its current state.
What Does All This Mean?
All of this has left us with some heady questions between the cause of the crash, the impact of the disease, and potential length and depth of the market crash. Here are some of the theories we are working on to think ahead for the next emergency similar to this one.
1. Stock Prices Were Inflated
I’m not sure of many on Wall Street that wouldn’t have argued that stocks were due for a tumble some point. Record high P/E ratios, a 10 year bull market, and slowing growth all gave off the feeling that the bull market was nearing its end. At Nintai we had reached nearly 30% cash in some portfolios being unable to find anything that met our criteria or margin of safety. With the rebound in prices over the past few days, most buying opportunities have passed by already.
Greater Fear (As per VIX) Leads to More 1-Based Correlation
During the crash of February and March 2019, the VIX reached its highest level since the Great Recession. When the VIX reaches such stratospheric levels (66.2 in December 2008 and 65.65 on March 27 2020) nearly every asset is correlated. In other words, there are very few places to hide when the vast majority of investors are convinced the markets will drop.
Non-Controllable Events Lead to More 1-Based Correlation
Fear can be generated by fear or uncertainty or both. In some economic situations fear can be driven by poor earnings results or missed expectations. Uncertainty can be caused by a simply non-measurable event – meaning there is no way to quantify both the odds of it happening and the scope of the event. Fear and uncertainty can be a deadly mix on wall street. When they say “Wall Street has to climb the wall of worry”, they aren’t kidding.
Conclusions
Over the course of the last month, several key learnings have come back to haunt investors. The first is that fear - real gut wrenching, visceral fear - forces a wide range of investors to act in a similar way. This can be value versus growth, small-cap versus large-cap, low-yield versus high-yield. When investors panic, the phrase “no place to hide” really means that many seemingly different asset classes suddenly all begin correlate to each other. Stocks, bonds, energy, utilities, REITs, etc. all begin to drop in similar ways and in similar amounts. In other words - the dreadful 1-factor correlation. The second learning is that crashes like we’ve seen over the past month are by far easiest ways to differentiate your returns (for both good and bad) against the general markets and individual investors. At Nintai Investments, we’ve seen our outperformance with the Russell 2000 jump from roughly 2 - 5% at the beginning of February to 20 – 25% by the end of March 2020[2]. Which brings us to the third finding. To give yourself a chance at outperformance, you really need to invest differently than the indexes and other investors. Whether it be 30% cash, 20% in microcaps, or investments in only 4 of the 11 S&P 500 industry categories (all characteristics of Nintai Investment portfolios), investors should find their niche and make it their own. Great value investors find their niche - purchase shares at a considerable discount to fair value – and hang on for the journey. The ability to differentiate your investment from the dreaded bear market 1 correlation will in the end decide how successful you are in the long term.
As always I look forward to your thoughts and comments.
DISCLOSURES: None
[1] “Correlations Going to 1: Amid Market Collapse, U.S. Stock Fund Fs Show Little Differentiation”, David Carey, Tom Lauricella, Mar 6, 2020
[2] Past investment performance does not ensure future returns
 RSS Feed