“Sometimes things go against you for months, quarters, and even years. It’s hard when the whole market is going down with you, but it’s tough when your positions drop and others keep going up. But you can’t lose faith in your process. If you believe you are correct, you must ride it out.”
- Charles Tompkins
Last month, I talked about the Magnificent Seven (M7) and the role of the fear of missing out (FOMO). Indeed, many investors have had to confront this as the M7 continues its surge forward as we near the year's halfway point. I thought it might be interesting to compare the rise in M7 stocks versus some of Nintai’s portfolio holdings and discuss the difference in performance.
One of the peculiar distinctions over the past several years between M7 stocks and Nintai Investments portfolio holdings is the disconnect between growth in free cash flow versus stock price appreciation. For the M7 stocks, the percent increase in free cash flow has generally been exceeded by the percent in stock appreciation, meaning that as the company has increased free cash flow by 15% annually, the stock price has appreciated by 25% annually. This has led to ever-increasing P/E and P/FCF ratios. For instance, Meta’s P/E ratio has gone from 14.01 in 2022 to 28.3 in 2024. Nvidia’s P/E ratio has gone from 21.7 in 2019 to 75.8 in 2024. These increases in P/E ratios are the clearest indication that prices are advancing far quicker than earnings. Conversely, Nintai holding Veeva’s P/E ratio has gone from 117.1 in 2021 to 47.3 in 2024.
Before I discuss the differences between Nintai’s holdings and the M7 stocks, I thought I would add some additional data to the conversation.
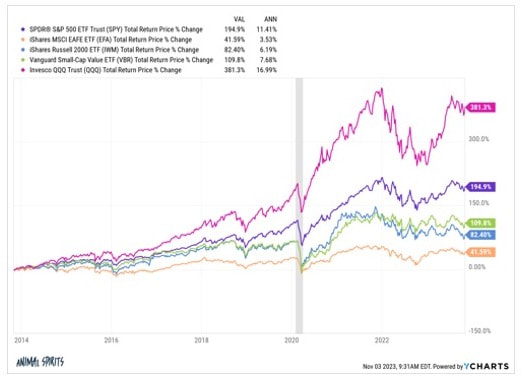
Nvidia & Generative AI Hype: On a day (June 13, 2024) when the Nintai Model Portfolio was down -0.37%, and Nvidia was up +3.52%, it seems pertinent to point out some information regarding Nvidia and the Generative Artificial Intelligence hype cycle. Through May 30, 2024, Nvidia (NVDA) has accounted for approximately one-third of the S&P 500 Index's return. That isn’t a typo: one company out of 500 accounts for 33% of the S&P 500's return. With no exposure to Nvidia in 2024 - due to our assessment that the stock has generally been priced at a premium to fair value - approximately 36% of the Nintai Investments portfolios’ underperformance has come from its lack of Nvidia.
The Magnificent Seven: The Magnificent Seven stocks (Alphabet (GOOGL), Amazon (AMZN), Apple (AAPL), Meta (META), Microsoft (MSFT), Nvidia, and Tesla (TSLA)) accounted for more than 50% of the S&P 500 Index's YTD returns - and that includes pretty poor starts to the year from Tesla and Apple. Excluding these two laggards, nearly 60% of the S&P 500 YTD returns are explained by the remaining Magnificent Five companies.
Stock Selections: Several stocks in the Morningstar Moat Index in Nintai Investment portfolios have posted disappointing returns in 2024 due to investor emotions and macro-driven concerns. That is not to say that others have not performed well.
- Charles Tompkins
Last month, I talked about the Magnificent Seven (M7) and the role of the fear of missing out (FOMO). Indeed, many investors have had to confront this as the M7 continues its surge forward as we near the year's halfway point. I thought it might be interesting to compare the rise in M7 stocks versus some of Nintai’s portfolio holdings and discuss the difference in performance.
One of the peculiar distinctions over the past several years between M7 stocks and Nintai Investments portfolio holdings is the disconnect between growth in free cash flow versus stock price appreciation. For the M7 stocks, the percent increase in free cash flow has generally been exceeded by the percent in stock appreciation, meaning that as the company has increased free cash flow by 15% annually, the stock price has appreciated by 25% annually. This has led to ever-increasing P/E and P/FCF ratios. For instance, Meta’s P/E ratio has gone from 14.01 in 2022 to 28.3 in 2024. Nvidia’s P/E ratio has gone from 21.7 in 2019 to 75.8 in 2024. These increases in P/E ratios are the clearest indication that prices are advancing far quicker than earnings. Conversely, Nintai holding Veeva’s P/E ratio has gone from 117.1 in 2021 to 47.3 in 2024.
Before I discuss the differences between Nintai’s holdings and the M7 stocks, I thought I would add some additional data to the conversation.
Nvidia & Generative AI Hype: On a day (June 13, 2024) when the Nintai Model Portfolio was down -0.37%, and Nvidia was up +3.52%, it seems pertinent to point out some information regarding Nvidia and the Generative Artificial Intelligence hype cycle. Through May 30, 2024, Nvidia (NVDA) has accounted for approximately one-third of the S&P 500 Index's return. That isn’t a typo: one company out of 500 accounts for 33% of the S&P 500's return. With no exposure to Nvidia in 2024 - due to our assessment that the stock has generally been priced at a premium to fair value - approximately 36% of the Nintai Investments portfolios’ underperformance has come from its lack of Nvidia.
The Magnificent Seven: The Magnificent Seven stocks (Alphabet (GOOGL), Amazon (AMZN), Apple (AAPL), Meta (META), Microsoft (MSFT), Nvidia, and Tesla (TSLA)) accounted for more than 50% of the S&P 500 Index's YTD returns - and that includes pretty poor starts to the year from Tesla and Apple. Excluding these two laggards, nearly 60% of the S&P 500 YTD returns are explained by the remaining Magnificent Five companies.
Stock Selections: Several stocks in the Morningstar Moat Index in Nintai Investment portfolios have posted disappointing returns in 2024 due to investor emotions and macro-driven concerns. That is not to say that others have not performed well.

Of course, Nintai has had several stocks not large enough to be in the S&P 500 that have generated equally detracting returns YTD. These include Paycom (PAYC) -29.9% return, Genmab’s (GMAB) -17.1% return, and Veeva’s (VEEV) -20.1% return.
Free Cash Flow Growth and Stock Price: A Lack of Correlation
So, what’s going on here? Why has the M7 made up such a significant component of returns of the &P 500? Perhaps the most central issue from our perspective at Nintai is the lack of correlation between free cash flow growth and a company’s stock price. As we’ve stated many times before, we don’t use earnings as a major component in assessing intrinsic value in our corporate valuation tools. As the classic adage (somewhat) goes, earnings are an opinion; free cash flow is a fact.
Our valuation tools work under the assumption that long-term free cash flow growth will ultimately lead to an increase in intrinsic value. The inverse is equally true. That said, occasionally, markets will diverge from this model – the stock price will increase without a commensurate increase in free cash flow, or the stock price will go down even though the company is seeing strong growth in free cash flow. Unfortunately, in the past couple of years, we’ve had both examples of this. In the past several years, the M7 has seen stock prices increase far more than free cash flow growth, while Nintai portfolio positions have seen stock prices decline even as their free cash growth has been substantial. Let’s take a look at some cases.
Meta Platforms
In the case of Meta Platforms (META - until recently known as Facebook), the share price has roughly tracked its free cash flow growth. As free cash flow dramatically dropped in 2022, so did the company’s stock price. Conversely, as free cash flow recovered in 2023 and 2024, so did the stock price. However, as with many M7 stocks, the increase in stock price by percentage exceeds the growth in the free cash. For instance, Meta’s stock price increased by nearly double the rate of free cash flow growth during the previously mentioned time frame.

Another M7 stock followed a very similar pattern. Nvidia is the poster child for M7 excess in terms of price becoming disconnected from free cash flow.
Nvidia
From 2018 – 2024, Nvidia increased its annual free cash flow from $4.69 per share to $32 per share. During that time, the company grew free cash flow at a 31.6% CAGR. In the same period, the company stock price went from $35.94 per share to $1,164.37 per share, or a 64.4% CAGR. Seen from a different angle, investors were willing to pay very generously for Nvidia’s growth in free cash flow.

This has been a prevailing trend in the M7 stocks and is one of the main reasons why these stocks have generated such a large percentage of the S&P 500’s gains over the past few years. For fund managers who invest in smaller holdings or even stocks that represent the remaining S&P 493, their returns have suffered significantly.
Similar Companies, Different Results
One of the most frustrating aspects of being an investor over the past several years has been watching returns of Nintai’s holdings. Many of the stocks in our portfolios have grown free cash flows at outstanding rates and seen stock prices drop in many cases. Two cases tell very similar stories.
Veeva Systems
Veeva has been a long-term holding in Nintai portfolios. The company converts roughly 40% of revenue into free cash, generates a return on equity in the high-20s and return on capital in the mid-30s, carries no short—or long-term debt, and has over $1B in cash/short-term securities on the balance sheet. In the past (from 2013 – 2020), investors priced shares at a premium, similar to how they look at Nvidia today. But looking at the graph below, one can see a rapid reversion starting in 2021 and carrying through today. The stock price has dropped from a high of $276 in 2021 to $173 in 2024 even though free cash has increased by roughly 11% CAGR ($4.80 in 2021 to $7.12 in 2024).

A question that we ask at Nintai is, what happened after 2020? Why did the markets suddenly change their view on the company even though its fundamentals remained so strong? Veeva wasn’t alone in this trend.
Skyworks Solutions
Skyworks Solutions, another Nintai holding, had a very similar trend. In the period from 2021 to 2024, the stock price dropped by 45% from $165 to $91. In the same period, free cash flow rose by 62%.
Skyworks Solutions
Skyworks Solutions, another Nintai holding, had a very similar trend. In the period from 2021 to 2024, the stock price dropped by 45% from $165 to $91. In the same period, free cash flow rose by 62%.

What This Means
In our first four years, the Nintai Investment portfolios significantly outperformed the S&P 500. The last three years have seen a near mirror image of these results. During those initial four years, investors paid an increasing amount for each dollar of free cash flow, with many portfolio holdings generating significant returns. Starting in 2020 – 2021, many of these same companies continue to grow free cash flow, remain debt-free, and generate outstanding return on capital.
So what happened? First, it’s always important to remember the concept of reversion to the mean. For stocks or portfolios that outperform for stretches of time, it is frequent to see stretches of underperformance to follow. Outperformance can’t last forever (unless, of course, your name is Bernie Madoff). To outperform, you must necessarily underperform at some point. Reversion to the mean is an ugly process to endure, but as a long-term overperformer, you will have stretches like this to endure.
Second, markets are prone to emotional bursts of irrational exuberance for certain types of stocks (the 20s Conglomerates, the 70s Nifty Fifty, the 90s Tech Stocks, etc.) or for certain industries (Biotechnology in the 90s, Nanotechnology late 2000s, et.). We are currently in a run of three hyped trends – crypto/digital currency, artificial intelligence, and MEME stocks. In the first case, we have companies based on fancifully named “coins” with no way to value them in any rational financial or economic model. This was the first craze that took the wind from the sales of quality companies earning real free cash like those in Nintai portfolios. The crash of the cyber markets has led to a new gold rush in Artificial Intelligence (AI), seen as the next “it” thing that will change the foundations of our societies and economies. Last are the MEME stocks, which are usually found on internet discussion sites such as Reddit. These stocks’ prices can rise or fall by as much as 100%, dependent upon comments from writers with strange animal names with little or no financial background.
Unfortunately (or actually, fortunately), stocks in the Nintai portfolios reflect none of the characteristics of these three stocks. Combined with reversion to the mean, we think our portfolio holdings are suffering from a general rejection of staid, high-quality companies that generate significant free cash flow, keep their noses down, and focus on their core business.
Conclusions
We’ve been talking about the same thing during our times of outperformance and during times of underperformance. We look for find companies with significant competitive moats that generate high returns on capital, convert a significant percentage of revenue into free cash flow, have little/no debt, and are run by trustworthy management. We think over the long term these companies will outperform the general markets and generate adequate returns to our investors (and our own internal investors since we invest in the same companies).
Of course, the greatest challenge is holding steady during times of underperformance. But when you look at the performance of companies like Veeva or Skyworks (or any other company in Nintai portfolio, for that matter), we feel comfortable the companies are building long-term intrinsic value which will be recognized at some point.
We hope you have found this analysis of some interest, and as always, look forward to your thoughts and comments.
DISCLOSURE: Nintai Investments and its staff currently have positions in MarketAxess, Biogen, Paycom, Genmab, Veeva, and Skyworks.


 RSS Feed