NINTAI INVESTMENTS
  • About
  • Nintai Insights
  • Recommended Reading
  • Contact
  • Performance
  • Client Forms

The Overreaction hypothesis

7/21/2015

0 Comments

 
DISCLOSURE: We are long SWI

In 1863 during the battle of Gettysburg, Union general Daniel Sickles decided to move his troops far in advance of the line demarcated by his superiors. As the troops moved out with flags flying and bands playing, another Union officer – Winfield Scott Hancock – watched the movement with great consternation. One of his staff officers commented that Sickles’ was disobeying orders. General Hancock looked through his binoculars, sighed, and said “they’ll come tumbling back soon enough.” And indeed they did. Hit with an enormous wave of Confederate soldiers, Sickles and his men suffered enormous losses almost causing the Union to lose the battle – if not the war.

 The Overreaction Hypothesis

 I bring this up because a stock on our watch list - SolarWinds (SWI) - had been roughly flat YTD until – in the words of Hancock – it came tumbling back losing 24.5% last Friday. In one day the company’s stock had gone from being roughly 10% undervalue to nearly 30% undervalue. A tumble indeed. Looking at the quarterly report and revised outlook we think the markets clearly overreacted to the call. We will get into the numbers in greater detail later in this article, but it would be helpful first to discuss why the market’s overreaction is important.

 A seminal work on this topic was published by Werner De Bondt and Richard Thaler in 1985[1]. In their study, Bondt and Thaler placed the top performing 35 stocks over the past three (3) years into a portfolio entitled “Winners”. Correspondingly the worst performing 35 stocks were placed in a “Losers” portfolio. They then tracked each portfolio's performance against a representative market index for three years.

 So what did they find? Interestingly the “Losers” portfolio beat the markets handily while the “Winners” portfolio underperformed significantly. The cumulative difference between the two portfolios was roughly 25% over the three-year period. A case of inversion if we’ve ever seen one.

 The essence of their findings was that for every overreaction in a stock price there is an equal counter reaction. This works in both highly valued and low valued stocks alike. They described it as such:

 “If stock prices systematically overshoot, then their reversal should be predictable from past return data alone, with no use of any accounting data such as earnings. Specifically, two hypotheses are suggested:

1.    Extreme movements in stock prices will be followed by subsequent price movements in the opposite direction.

2.    The more extreme the initial price movement, the greater will be the subsequent adjustment."

 They went on to state there were three (3) core propositions that make up the actual amount of the overreaction. These include:

 1.    Directional Effect: Extreme movements in equity prices will be followed by movements in opposite direction.

2.    Magnitude Effect: The more extreme the initial price change, the more extreme the offsetting reaction.

3.    Intensity Effect: The shorter the duration of the initial price change, the more extreme the subsequent response.

 SolarWinds: An Example

 A case of the Overreaction Hypothesis is a stock that was on our watch list and now currently is a portfolio holding – SolarWinds (SWI). This is a company we would love to hold for the long term. Return on Equity of 21%, Return on Capital of 23%, no debt, $542M on the balance sheet, and conversion of 47% of revenue into free cash. Management has grown revenue at 21% annually since 2005 and free cash at 14% since 2010.

 Last Thursday, management reported Q2 numbers. In addition to missing Q2 revenue estimates (while beating on EPS), the company guided for Q3 revenue of $130M-$134M (+15%-19% Y/Y, below a $136.1M consensus) and 2015 revenue of $502M-$512M (+17%-19% Y/Y, below a $519.7M consensus). EPS guidance was better: $0.49-$0.53 for Q3 (consensus is at $0.52) and $2.00-$2.08 for 2015 (consensus is at $2.00).

 Anatomy of an Overreaction

 These results provoked a collapse in the stock price – dropping to $35.54 or down 24.5% from its close of $47.05 on July 16th. We were surprised by the reaction of the markets. SWI reduced Q3 revenue guidance by 4.5% but is still projecting 15%-19% Y/Y growth. 2015 revenue estimates were reduced by 3.5% but still projecting 17%-19% Y/Y growth. Using a DCF model these changes reduced our estimated fair value from $54/share to $53/share or an estimated decrease of less than 2%. Friday’s loss would say that SWI is worth roughly 25% less today than it was last week. Followers of Efficient Market Theory (EMT) would tell us the price decrease represents the best information available and the true value of the company’s shares.  We think this type of thinking is silly and a gross overreaction to Thursday’s earnings call.

Now that we’ve seen the massive downside movement, according to Bondt and Thaler we should see a short-term, significant upturn in price. That may be. But even if this doesn't work out, we have in our back pocket the ultimate asset for the value investor – an outstanding company selling at a significant discount to our estimated intrinsic value.   

 Conclusions

 The Overreaction Hypothesis would tell us that for every market overreaction there is generally an overreaction in the opposite direction. Purchasing stocks that had such events on the negative side achieved significant outperformance versus those on the positive side. This makes sense as – generally -  overreaction to the negative side can create opportunities at mispriced value. Those on the upside have generally stretched valuations. Whether SolarWinds is a successful example of the Overreaction Hypothesis will be tested over the next several months. Combined with its valuation, this is a transaction where we think the odds are in our favor over the long term.  

[1] “Does the Stock Market Overreact?”, Werner F. M. De Bondt and Richard Thaler
The Journal of Finance, Vol. 40, No. 3, Papers and Proceedings of the Forty-Third Annual Meeting American Finance Association, Dallas, Texas, December 28-30, 1984 (Jul., 1985)
0 Comments

Risk and Uncertainty Redux: Part II

7/18/2015

0 Comments

 
“90% of risk in our investment lives can be mitigated by doing nothing. The ability to sit and let long-term value creation work without expenses is the eighth wonder of the world. If you choose your investment wisely – by not overpaying, finding reasonable profitability, and seeking a competitive advantage – time can (in general!) only be your friend and not your enemy in investment returns”. 

                                                                                                                 - John Thurman

 In last week’s article we discussed the role of risk and uncertainty in value investing. More particularly, we focused on the how we make the distinction between the two during our valuation process. In the article we discussed there were two critical questions to ask about risk and uncertainty.

1. How do we assign and quantify a proper amount of risk to these situations and;

2. How do we mitigate that risk through price and value?

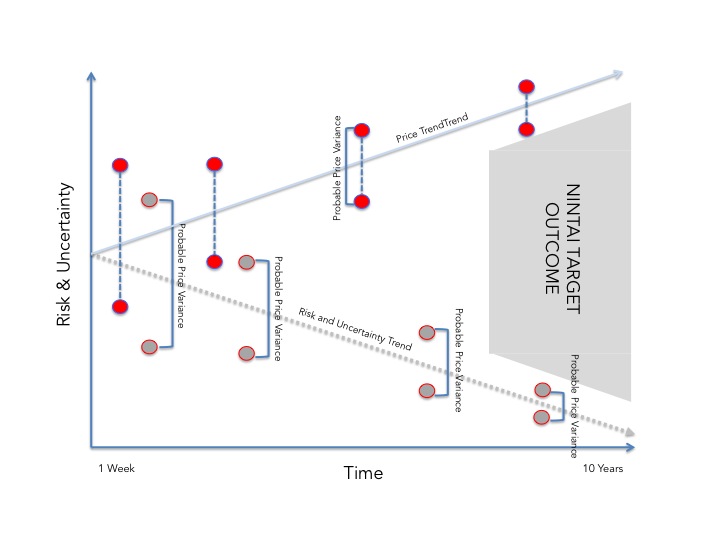
 In this article I wanted to discuss the second question. At Nintai we see this as a core value in our investment strategy. Time and price must be our allies as we are simply not smart enough to calculate the short-term volatility of the markets and individual stock prices. We use a graphic to demonstrate our thinking when we explain this to our investors. 

Picture
In this graphic one axis represents risk and uncertainty while the other represents time. There are two trend lines. The first represents price while the other represents risk. Within these trend lines are bands representing potential variance. Over time, both risk and price variability is reduced. Located to the right is a grey area where Nintai targets our outcomes based on a.) reduced risk and price variables and b.) compounding stock price. We see the two trend lines as a jaw – the closer one moves to the left the smaller the mouth and the greater the chance of being bit.

 There is of course one key variable missing from this diagram – value. Meaning that if you overpay the price trend line isn’t guaranteed to move upwards. Graham clearly understood this when he wrote:

 “A loss of value which either is realized through actual sale, or is caused by a significant deterioration in the company’s position – or, more frequently perhaps, is the result of the payment of an excessive price in relation to the intrinsic worth of the security.”

 Overpaying means the price trend may be flat to negative regardless of time. In our models the starting price on the left axis can move up or down. Dependent on the slopes of trend lines we might take a closer look at a potential investment.

 One of the dangers of a nifty graphic like this is that investors believe we can create a relatively accurate risk/reward model for each potential investment. Let me be very clear: we cannot do this in any way, shape or form. When working with a graphic we believe there are three (3) key caveats investors – and the Nintai team – must constantly bear in mind.

 We Have No Idea About Future Risk and Uncertainty…….

The simple fact is we really don't know what future risk and uncertainty will be for our investments. John Maynard Keyne’s once wrote “there is little likelihood of our discovering a method of recognizing particular probabilities, without any assistance whatever from intuition or direct judgment. A proposition is not probable because we think it so (my emphasis)”. Just because we think we can predict the future return of an investment – even as a series of probabilities – doesn't mean it will turn out anything like we plan or desire. That doesn't mean we stop investing. It simply means we do what we can with the tools we have to mitigate risk and uncertainty and set our expectations appropriately.

 …….So We Will Most Certainly Underestimate Risk & Uncertainty

Wall Street has always felt it has a better understanding of risk and uncertainty than it really does. Theories such as Efficient Market Hypothesis (EMH), Sharpe Ratios, Beta, Capital Asset Pricing Models (CAPM), and Modern Portfolio Theory (MPT) make investment risk management resemble a measurable science. The reality is quite different. During the 2008 global crisis there were an estimated 15-20 ten-sigma events (meaning according to Gaussian distribution there is an extraordinarily small chance of one – let alone 15-20 events – happening[1]). So what happened? How did everyone get it so wrong? The simple fact is we simply underestimated the risk. Accordingly we also mispriced the risk which led to truly disastrous investment and policy decisions. At Nintai we realize we will always underestimate both risk and uncertainty. Hence our focus on time and price as mitigators of our errors.

 Bad Valuations and Pricing Can Overwhelm Time

During times of nearly daily market highs we find that we must fight against what Howard Marks refers to as FOMO (Fear Of Missing Out) risk. It’s extraordinarily difficult to sit on the sidelines and watch stocks to continue to rise. At Nintai we find ourselves facing this situation as we write. During these times we try to focus on finding great companies that meet our investment criteria, take a deep breath, and wait for the right price. We do this because we know – and this with some certainty! – it is nearly impossible to overcome paying too much for a company’s shares. Almost no time horizon can mitigate risk when an investor overpays. Just ask individuals who purchased Cisco in January, 2000. Price is the spring - which when wound up tight (meaning price and value are compressed) - can help provide the extraordinary long returns we all want in the portfolio. 

 Conclusions

The future is unknowable. But that doesn't prevent us from purchasing company shares at a discount to fair value, with a competitive moat, high profitability, and rock solid financials. We invest in companies like these for the long term. Time and price can be the foundation not only for reduction of risk but also long-term investment returns. We believe our investment partners have been rewarded handsomely when Nintai measures a potential investment with risk, uncertainty, price, and time in mind. In today’s market we think it’s even more important to evaluate stocks within this framework.


[1] In 2008 there was even a 23 sigma event in the commercial real estate credit default swap market. As one writer put it “it is roughly equivalent to your to your odds of being hit by lightening at 3:02PM tomorrow while you are sitting in your office chair on the 43rd floor of an office building – through the glass”. 


0 Comments

Risk and uncertainty redux

7/9/2015

0 Comments

 
In an article we wrote earlier this year ("The Four Horsemen: Risk, Uncertainty, Price, and Value" which can be found here) we discussed the difference between risk and uncertainty and how price and value are key mitigators of these. I thought we'd revisit this in light of the Greek crisis, the recent crash in oil prices, and the swoon in Chinese stocks. These latter factors have one commonality to investors: They represent uncertainty to equity buyers and sellers. The critical questions we now have to ask are:

1. How do we assign and quantify a proper amount of risk to these situations and;

2. How do we mitigate that risk through price and value?

In this week's article, I thought it might be helpful to take a deeper dive as to how Nintai views the first question. Before we begin the process of answering these two questions, it would be wise to review the difference between risk and uncertainty. As quoted in my previous article, Nate Silver's The Signal and the Noise description is highly applicable to our situation today:


"Risk, as first articulated by the economist Frank H. Knight in 1921, is something that you can put a price on. Say that you’ll win a poker hand unless your opponent draws to an inside straight: the chances of that happening are exactly 1 chance in 11. This is risk. It is not pleasant when you take a “bad beat” in poker, but at least you know the odds of it and can account for it ahead of time. In the long run, you’ll make a profit from your opponents making desperate draws with insufficient odds. Uncertainty, on the other hand, is risk that is hard to measure. You might have some vague awareness of the demons lurking out there. You might even be acutely concerned about them. But you have no real idea how many of them there are or when they might strike. Your back-of-the-envelope estimate might be off by a factor of 100 or by a factor of 1,000; there is no good way to know. This is uncertainty. Risk greases the wheels of a free-market economy; uncertainty grinds them to a halt (my emphasis)."

We think this last sentence is particularly appropriate for today’s markets. We believe that both risk and uncertainty are going to impact the stock prices going forward. But if this is true then how do we prepare our portfolio against an impending storm?

Separating the Wheat and the Chaff

One of the most important distinctions one can make when beginning to understand a portfolio company’s downside potential is separating risk from uncertainty. At Nintai we do this with the following questions:

  1. Is the issue quantifiable? In this case can we say that a reduction in China’s growth from 8% to 5% would decrease our company’s revenue by X%?
  2. Is the linkage clear? In this instance we need to see a direct and measurable impact between the issue and our company. For instance, does the Greek default directly impact our corporate investment through debt restructuring, direct investments, and/or plants and operations?
  3. Can we quantify the parts? Each issue we see in our potential investment needs to be broken into component parts. These parts are then quantified and added to the mix. For issues such as the Chinese market meltdown there some parts of the issue that simply can't be made distinct (such as Xiao's commitment to market reform).
If any issue we come across can’t be answered satisfactorily, then we place it in the uncertainty bucket. All others are rigorously evaluated, calculated, and plugged into our valuation calculation.

Risk and Uncertainty: Which Matters Most? 

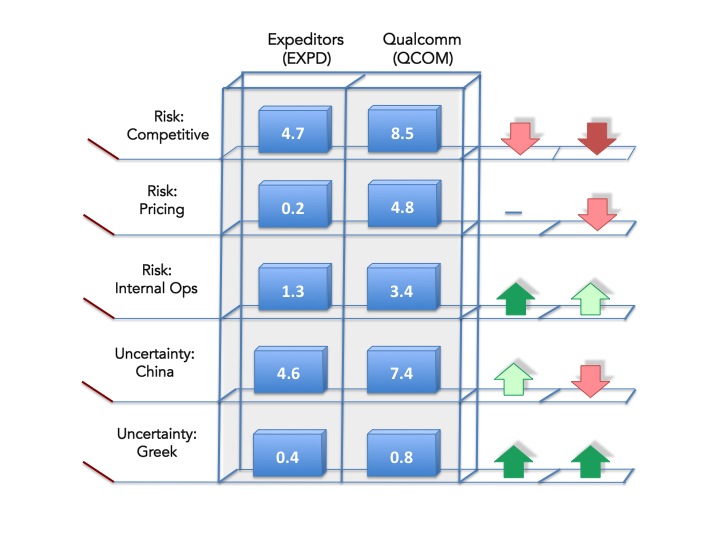
This is all well and good until it comes time to evaluate our uncertainties. Are they more or less important than our defined risks? What impact would/should they have on our potential investment’s value? There really isn't an exact answer to these questions. We’ve programmed Nintai’s Abacus evaluation tool to break out risk from uncertainty and weight uncertainties at roughly 125% of risk. We believe not being able to quantify or get a firm grip on an issue should make us less – rather than more – confident in our valuations. Seen below is a screenshot looking at Expeditors International (EXPD) and Qualcomm (QCOM) measuring several risk and uncertainty measures. (Note: these numbers are for raw evaluation only. They do not take into account the uncertainty percentage increases).

Picture
In this review we see both risk and uncertainty are both higher for Qualcomm than Expeditors. We have assigned value in the uncertainty categories (China and Greece) to the best of our ability but generally take a more conservative estimate than risk based criteria. These two categories will be reformulated appropriately in the next valuation step.

Only Half the Equation

Next week, we will discuss the key mitigators of risk and uncertainty: price and time. Without that context in the valuation process, these two categories are two islands standing alone and can play only a limited role. As we wrote in our previous article:

“When considering risk and uncertainty we propose that price and value are the great equalizers. Howard Marks (Trades, Portfolio) once wrote, “No asset class or investment has the birthright of a high [or low] return. It’s only attractive if it’s priced right”. Stocks with an enormous amount of uncertainty can be considered a reasonable investment opportunity if the price is sufficiently below intrinsic value. Conversely a company with very little uncertainty can be extraordinarily risky if purchased significantly above fair value. When thinking about these two factors, it is essential investors always place them in the context of value and price.

0 Comments

    Author

    Mr. Macpherson is the Chief Investment Officer and Managing Director of Nintai Investments LLC. 

    Archives

    January 2023
    December 2022
    November 2022
    October 2022
    September 2022
    August 2022
    July 2022
    June 2022
    May 2022
    April 2022
    March 2022
    December 2021
    October 2021
    August 2021
    July 2021
    June 2021
    May 2021
    April 2021
    March 2021
    February 2021
    January 2021
    December 2020
    October 2020
    September 2020
    August 2020
    July 2020
    June 2020
    May 2020
    April 2020
    March 2020
    February 2020
    January 2020
    December 2019
    November 2019
    September 2019
    August 2019
    July 2019
    June 2019
    May 2019
    April 2019
    March 2019
    January 2019
    December 2018
    November 2018
    October 2018
    September 2018
    July 2018
    June 2018
    May 2018
    March 2018
    February 2018
    December 2017
    September 2017
    August 2017
    June 2017
    May 2017
    April 2017
    March 2017
    January 2017
    December 2016
    November 2016
    October 2016
    August 2016
    July 2016
    June 2016
    May 2016
    April 2016
    March 2016
    February 2016
    January 2016
    December 2015
    November 2015
    October 2015
    September 2015
    August 2015
    July 2015
    June 2015
    May 2015
    April 2015
    March 2015
    February 2015
    January 2015
    December 2014

    Categories

    All

    RSS Feed

Proudly powered by Weebly