At the Nintai Charitable Trust we have a tendency to deviate from traditional value investing in the criteria we use searching for potential investments. We generally screen for extremely high quality companies ruling out the more traditional cigar butt or net/nets that Benjamin Graham made so famous. This doesn't mean one method is better than the other. We simply have better results – within our own behavioral constraints – utilizing our own system.
For many investors, the price-to-earnings ratio is critical to ascertaining value. For my compatriot John Dorfman, a PE of 10 or less is a hard criterion for selecting opportunities. At the Nintai Charitable Trust we rarely look at the PE when considering a stock. We utilize a much different number which we think gives us a number more relevant to our investment goals. This is cash return.
Cash return
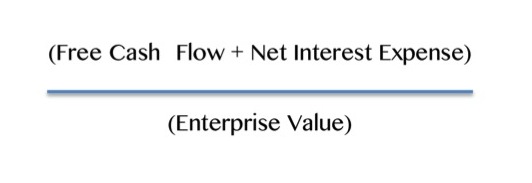
Cash return is a metric rarely found these days in investment analysis. That’s a shame. Cash return allows us to quickly analyze two factors about an investment opportunity. First, the cash return metric measures how efficiently the business is using its capital – both equity and debt – to generate free cash flow. Second, it can tell us how the stock stacks up – valuewise – against a risk-free investment in U.S. Treasuries or slightly more risky high quality corporate bonds.
The formula for cash return is actually quite simple
We like cash return as a first step in ascertaining the long-term valuation of the company in the context of the equity risk premium.
A working example
I’ll use F5 Networks (NASDAQ:FFIV), a current Nintai Charitable Trust holding, as an example. In January 2016 the company had a market cap of $6.4 billion, had no long-term debt and had $774 million in cash on the balance sheet. Its enterprise value is $5.7 billion ($6.4 billion + $0 – $774 million). For the denominator F5 Networks generated $617 million in adjusted free cash flow. Thus the cash return for the company is 11% ($617 million/$5.7 billion).
With 10-year Treasuries yielding just 2.3% and corporate bonds yielding a higher (but still pretty low) 3.2% in January 2016, the 11% cash return for F5 Networks is more than adequate. Given the fact that F5’s free cash flow has grown at an average 24.7% annually over the past 10 years and 16.5% over the past five years and bond payments are fixed, F5 Networks starts to look interesting.
When looking at F5, many value investors might pass immediately when seeing a P/E of 19. Certainly those who more rigorously apply Benjamin Graham’s low P/E strategy would likely reject it. But we think cash return tells us a different story. Measured against a risk-free (or should we say “relatively risk free” these days!) investment in U.S. Treasuries, F5 compensates its higher risk with a much higher reward. Looked at in this manner, the company might be perceived as a more “value-based” investment than others would say. Does the cash return make F5 a strong investment opportunity? That we can’t say. Only by utilizing far more detailed discounted cash flow models, market analyses, operational evaluation and competitive reviews can we make a more informed decision. But it certainly gives a different perspective than a PE ratio.
Conclusions
Utilizing cash return rather than the PE ratio isn’t better; it’s simply different. It has both its advantages and disadvantages in comparison. What makes it interesting is the fact that looking at potential investments through different lenses can provide us with unique insights that other investors may not see. As Haynes so succinctly put it, thinking differently is required to beat the crowd. By utilizing some less well-known measurement criteria, you can both analyze differently and achieve different insights than the crowd. Ultimately this allows you to either outperform or underperform the general markets, but you will know your returns are uniquely your own.

 RSS Feed