“There is little evidence of thought as to whether the price of a security already reflects current and projected future news flow, or whether the opening up of the economy might be premature, a sign not of strength, but of impatience, lack of resolve, and poor judgment.”
- Seth Klarman
Over the last three months, it seems the markets have been setting record highs on a regular basis. This despite the fact the Covid-19 pandemic continues ravaging huge swaths of our country averaging nearly 1,000 deaths per day. Large segments of the economy still face enormous job losses and the inability to open for business. Unemployment still hovers near 10% (nearing 14% several months ago) after reaching a record 2.3% just over 9 months ago. The killing of George Floyd led to a truly nation-wide outbreak of protests against injustice, police brutality, and race relations in general. All of this is - of course - taking place during a year of one the most consequential presidential elections in the past 50 years.
The stock market has always presented itself as a forward-looking mechanism. When trading began underneath the buttonwood tree on Wall Street in the 18th century, the first steps in creating an organized market became a reality. That market - which eventually became the New York Stock Exchange – would go on to provide hundreds of millions of dollars and eventually billions of capital to build the most powerful economy in the world. There have been times the Exchange has been in perfect alignment with the economy and others when there has been an almost total disconnect between the two. For instance from the 1973-1974 trough until roughly 1982, the markets had little correlation to what was to become the booming Reagan economy. By most value standards (and 20/20 hindsight), the markets traded at a large discount to the coming expansion and end of stagflation. By the mid- to late-1990s this had mostly inverted with stocks getting far ahead of the economy leading to what was to become the 1999-2000 technology bubble and subsequent crash.
In the last twenty years we have seen the markets go back and forth like this, making a hash of the efficient market school of thought. The question is how can an investor know when the markets are disconnected (in either an undervalued or overvalued manner) from the economy. The two tools I find most helpful are the simplest. One was created by Warren Buffett and the other by John “Jack” Bogle.
The Buffett Method
Warren Buffett is known for his folksy wisdom, but certainly his calculation in finding out if the markets are under- or overvalued according the US economy is remarkably simple and efficient. His model is based on several factors.
Corporate Profits Track GDP Long Term: First, over the long-term, corporate profitability must remain relatively closely correlated to the long-term growth of the US economy as measured by the Gross Domestic Product (GDP). That is to say that corporate profits cannot grow at 12% over the long-term if the GDP grows at 6% over the same time period.
Interest Rates are Equities’ Gravity: Second, interest rates serve as a gravitational pull for equity investments. If interest rates increase then equities must invariably decrease in value. The converse is true. If interest rates decrease then equities should rise. Many believe this has been the case since the 2007 - 2009 market crash. The US Federal Funds rate has been near zero percent and many countries are even moving into negative rates. These individuals (including this writer) thinks this has created an artificial floor pushing up stock prices.
Short Term Divergences Happen: Readers should note that the previous two factors reflect long term trends. In the short term, sometimes equity prices can drift remarkably far away from their normal correlation with the GDP. Think of the credit market bubble of 2005 - 2007. Real estate prices – along with their associated derivatives – became so extravagant it simply wasn’t possible for the trend to continue. Obviously they couldn’t in the long term and we saw the inevitable correction.
The beauty of Buffett’s model was he created a formula with two variables that can give investors a snapshot on the price/value relationship between equities and the GDP. The formula simply adds up the total market cap of all publicly traded equities and divides it by the Gross Domestic Product. The formula as of August 2020 was such:
Total Market Index ($34.7 T USD)
_______________________________ = 1.79
Gross Domestic Product ($19.4 T USD)
In this formula, 0.50 - 0.74 signifies the markets are significantly undervalued in relationship to the GDP, 0.75 - 0.89 the markets are undervalued, 0.90 - 1.10 the markets are fairly valued, 1.11 - 1.29 the markets are overvalued, >1.30 the markets are significantly overvalued. As you can see, the Buffett Method estimates the markets - at this time - are at nose bleed levels. According to this method, the markets have reached levels we haven’t seen since 1929 and 1999. Utilizing these numbers, the Buffett method projects a -2.9% annual return over the next decade. Not a particularly uplifting analysis.
The Bogle Method
John “Jack” Bogle was the founder of the modern index fund and also Vanguard, the index fund behemoth. His model was an attempt to predict what stock returns would look like out over the next decade. Bogle’s method had three factors that made up his calculation.
The Dividend Rate: According to Morningstar and the Hartford funds[1], since 1970 roughly 78% of the total return of the S&P 500 Index can be attributed to reinvested dividends. Let’s use an example of Person A and Person B starting to invest in 1970 with $10,000. Person A keep the dividends while Person B reinvests all dividends. The difference? By 2019 Person A has a total of $350,144 in their account. Person B has $1,626,370 in their account. Now that’s an example of the power of dividends and reinvestment. Hence dividends make up the first factor in Bogle’s formula.
The Projected Earnings Growth Rate: This variable is a little tricky because the smallest change can make a huge difference in your end results. But historically earnings growth has been roughly 5%. That includes some of the best years in the United States’ economic history. So let’s reduce that to a far more conservative 3% (you can of course make it whatever you want, but keep in mind for the formula to be helpful your estimates should be realistic.
Change in P/E Ratio:
The first two numbers used in Bogle’s formula are what he called the “investment components” of your total investment return. The third factor is not based on the investment, but rather on the investor. Bogle wants to know what an investor is willing to pay for a dollar’s worth of earnings. This is calculated by using the change in the P/E ratio. For instance, if an investor looks to purchase an investment and Stock A trades at a P/E of 9 and Stock B trades at a P/E of 22, then the investor is paying $9 for $1 in earnings in Stock A and $22 for $1 in earnings in Stock B. Thus stock B is trading at a significantly higher premium than Stock A. What Bogle does is he applies this to the entire market – meaning what was the P/E ratio at the beginning of the period and what would you reasonably expect it to be at the end. Here’s how the formula looked for the 2000s.
Dividend (1.2%) + Earnings Growth (0.8%) + Change in P/E (-3.2%) = -1.2%
Let’s apply this formula to see what we think might be equity returns over the next 10 years.
S&P500 Dividend Rate + Earnings Growth (Est) + Change in P/E (Est)
1.8% (July 2020) 2.4% -7.5% = - 3.3%
The dividend rate is a set number published monthly by Standard & Poors. There’s no fudging that number. Earnings growth is an estimate based on historical data. After a 10 year bull market - then a sudden crash caused by COVID-19 - we think earnings growth will be considerably muted over the next decade. Finally, stocks are trading at a 29.2 P/E ratio. This has only been exceeded three times - twice during the late 90’s tech bubble and once during the 2007-2009 credit crisis. Stocks weren’t even this expensive before the 1929 crash. Consequently, we thing the P/E ratio will have to drop dramatically to justify just 2.4% earnings growth. The Bogle Method lines up with the Buffett method pretty closely by projecting a -3.3% return over the next decade versus the -2.9% return projected by the Buffett method.
When an Unstoppable Force Meets an Immovable Object
So what happens when the estimated return formulas (driven by economic data) are completely at odds with market returns? For instance, in the second quarter of 2020 – due to the COVID pandemic – the US GDP shrank by 33%. This was the largest decrease since the Great Depression. Conversely, the S&P 500 generated a 19.1% return for the same quarter (it added another 5.5% in July 2020).
On one hand, we have an extremely volatile economy still fighting a raging pandemic. On the other is markets that seem to reach new highs on a daily or weekly basis. What is an investor to make of this? Do you invest or stay on the sidelines? We think a value investor must approach the problem with several rules in mind.
Whether Bull or Bear, Think Defensively
In times like this, when the market seems entirely disconnected from the economy, an investor (whether individual or professional) must maintain the fundamental concept that defines a great value investor - always, always protect to the downside. It can’t be said enough – recovering from a 40% drop requires a 67% gain. A 50% loss requires a 100% gain. More importantly, there is no coming back when you sell a paper loss and it becomes a real loss.
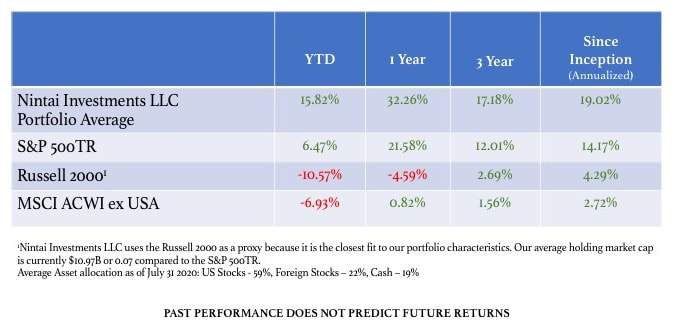
Nintai Investments average portfolio has done quite well against the market indexes over the year-to-date as well as 1 year and 3 years. Our outperformance has a great amount to do with our returns in Q4 2018 (-2.78% for Nintai Investment portfolios versus -14.33% for S&P 500TR) and Q1 2020 (-12.25% for Nintai Investment portfolios versus -21.08% for S&P 500TR). By keeping an eye out for the downside, we have found returns will do fine over the long-term.
Use All Tools Available to Us Now
Fifty years ago, very few investors (individual or professional) had ever heard of behavioral finance. There has been an explosion in the last decade in our understanding about how the human mind thinks about investing, making and losing money, decision making during stressful times, etc. Almost none of it leads us to be better investors. In fact, the field of behavioral finance is largely about avoiding emotional responses and biases in our decision making. Spending a small amount of time understanding the topic and building steps into your investment decision making process can pay large dividends over the long term.
Contrarian Thinking is Even Rarer Today
In 2009 index funds made up roughly 25% of all mutual fund assets. That’s now nearly 50% according to Morningstar. This growth of indexing has taken the art form of stock selection out of the hands of personal and professional investors and simply allowing computers and algorithms to make stock selections. At Nintai Investments, this has created an increasingly large gap between stocks that meet the needs of index funds and those that fall through the cracks. We think – over the long term – it’s never been (other than the 30’s and 40s of the last century) a better time to be an active manager in the value investment field. As jumbo cap companies take up an increasing amount of investment dollars (simply because they must be owned in most index funds), we find there are many small cap gems that are passed over and are diamonds in the rough ready to b scooped up. At Nintai, we strongly believe our performance reflects this type of thinking and success.
Conclusions
At the time of writing this article (August 2020), the S&P 500 was on the verge of setting a new high on a near weekly basis. At the same time, roughly 175,000 Americans have died of the corona virus, there has been roughly 5.7 million cases nationwide, and roughly 1,000 additional patients die per day. In the race for a cure, citizens seem to be blissfully ignorant of how long it takes to develop a vaccine, how effective that vaccine will be, and whether we will be looking at a second wave of infections combined with the standard influenza later this fall and winter. In July, the unemployment rate declined by 0.9 percentage point to 10.2 percent, and the number of unemployed persons fell by 1.4 million to 16.3 million. Despite declines over the past 3 months, these measures are up by 6.7 percentage points and 10.6 million - respectively - since February. Huge swaths of the US economy - retail, restaurants, airlines, etc. - continue to face ominous reports that many of their brethren are simply not coming back (In New York City, it is estimated nearly one out of every three restaurants will not reopen their doors).
With all of this going on, it’s hard to get your arms around the enormous gains made in the markets. Are investors simply ignorant, dumb or simply wildly optimistic? It’s hard to know because every bubble or pricey market is unique. There are so many variables it’s hard to build a model that takes everything into account. All that said, we try to keep our thinking straightforward and simple as possible. At Nintai, we think risks far outweigh rewards - this includes earnings growth, interest rates, debt levels, and general economic trends such as our politico-economic relations with China and the EU. We will continue to do what we do best by locating the highest quality companies that have been overlooked by the indexing world and trading at cheap prices relative to our estimated intrinsic value. We will also look for companies with rock solid financials with characteristics such as no debt, high free cash flow margins, and outstanding return on capital. Finally, we will continue to hold lots of dry powder until opportunities come along. We will work hard to avoid any unforced errors and not be rattled by bad news. In the final analysis, when markets are seemingly out of touch with the economy, its best to review your current holdings, work hard on your watch list and be patient. Anything else would be doing yourself and your investors a grave disservice.
 RSS Feed