“The ability to make good assumptions about the future is very difficult in the present moment. One small mistaken estimate today can lead to truly horrendous results later. They say a bird in the hand is worth two in the bush. If that’s the case, then you better be really sure about the reproductive qualities of that small avian creature you are holding”.
H. Joseph Davis
Last month I wrote about the necessity in today’s markets to double your efforts looking for risk in your portfolio. One of the issues I discussed was, “when using a discounted cash flow model there are two assumptions that can really skew your valuation - estimated future free cash flow and estimated cost of capital. Both are easy to get wrong.” An outcome from getting either of these wrong is its effect on terminal value.
Terminal value isn’t the definition of your holdings after you die (though we all worry about that at some point). It actually means a company’s present value at a future point in time of all future cash flows when a stable growth rate is projected forever. Now before you put this article down muttering dark thoughts about this writer, I encourage you to really understand this model. I certainly can’t make the claim it will increase your investment returns, but I think it will make you a better investor. So stay with me here.
A common method to calculate terminal value is the Gordon Growth Rate.
Final Year Projected FCF x (1 + Estimated Long Term Growth Rate)
-----------------------------------
(Discount Rate - Estimated Long Term Growth Rate)
One of the things that jumps out using the Gordon Growth Rate calculation is the importance of estimating long-term growth rates. Getting that wrong can make a huge difference in your terminal value. In my 10 year discounted cash flow model any free cash growth created beyond the final (“terminal”) year makes up a tremendous amount of my estimated terminal value. This places a great deal of pressure on getting the long-term growth rate correct. The danger in this process is (correctly) assuming the company will continue to grow free cash at a healthy rate over the next 15 – 20 years. There aren’t many companies out there that meet this criterion. Coca Cola (KO) is likely to be selling more of its eponymous soft drink 20 years from now. On the other hand, it’s hard to know if Blink Charging (CCGID) will even be selling residential and commercial EV charging equipment at all 20 years from now.
The Impact of Moats on Terminal Value
One way to mitigate the risk of having a too high (or too low) estimated long-term free cash flow growth rate is to utilize the concept of moats. These are defined as a company’s advantages used to retain its competitive position and pricing power over an extended period in the future. This can be achieved through proprietary technology, patents, etc. Moats have a direct impact on future free cash flow growth as they provide companies with a long runway of steady expansion. Moats can be one of the most important measures when calculating terminal value.
Sticking with the example of Coca Cola and Blink Charging, it’s relatively clear we could assign KO a very wide moat. With a 110-year history, enormous brand recognition, worldwide distribution network, and enormous market share, it’s likely Coke will still steadily grow its revenue over the next 20 years. Of course, there are threats to this moat even as I write - competitive pricing pressure, supply costs, demographic changes (less sugar required) and regulatory action such as the soda tax. The list is long and growing longer. But it’s important to remember Coke has survived two world wars, the Great Depression, and many other catastrophic events through its lifetime.
Blink Charging (CCGID) is an entirely different case. A company with a short history (public since 2012), Blink is dependent upon an evolving technology adoption along with a hyper competitive marketplace. With no industry leadership in place and battery technology facing constant pricing pressure from China, Blink has little to no competitive moat to help predict future cash flow. With return on assets of -412%, no earnings, and negative free cash flow it seems any estimate you develop at a future free cash flow growth rate is highly volatile to say the least.
Which company is the easier to estimate the rate of future free cash flow growth? Perhaps someone with a deep understanding of automotive design, battery design, engineering requirements of the eco-balance of lithium ion storage, and government regulations can model Blink’s future better than most. For the rest of us I believe Coke’s wide moat makes it far easier to model free cash flow over the next 15-20 years.
Why This Matters
For anybody looking to calculate terminal value, the ability to be as accurate as possible in your estimates is critical. A seemingly small difference can have dramatic impacts on your final estimates. As a hypothetical example let’s use Acme Rubber Band Company. Our company currently trades at $3.00 per share, has 10M shares outstanding, generates $1M in free cash, and has a weighted cost of capital of 10%. I’ve modeled the company valuation using a 3%, 6%, and 9% future free cash flow growth rate. Seen below are the results.
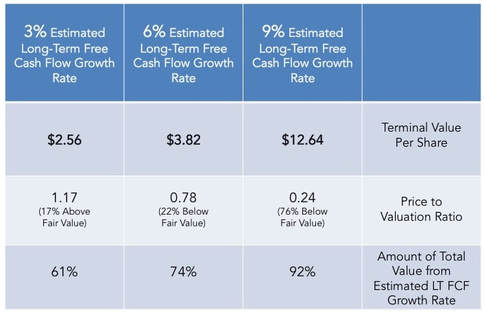
Several things jump out right away. The first is that even utilizing a seemingly low estimate of 3%, over 60% of the estimated value of the company’s terminal value is derived from the estimated long-term FCF growth rate. At 9% nearly the entire terminal value is derived from the estimated long-term FCF growth rate. This is clearly not a time to make a serious mistake in your projections. Second, the value per share can increase dramatically if you bump up the estimated long-term FCF growth rate. In Acme Rubber Band the company goes from 17% above fair value at a 3% growth rate and dramatically swings to 76% below fair value with a 9% growth rate.
Conclusions
The ability to accurately forecast future free cash flow can be greatly improved if a company has a wide competitive moat. All other things being equal, a company with a wide moat and consistently growing profits will be more valuable than a company that doesn’t have these characteristics. When using a discounted cash flow model, the ability to accurately predict future growth can significantly add to the chances for a successful investment decision. They say a bird in the hand is worth two in the bush. That may be true, but as Mr. Davis informs us, the ability to predict the future of a company’s growth accurately can really make your investments take flight.
 RSS Feed