The past 6 months have been an indexer’s dream. You simply couldn’t choose a bad asset class. It's difficult to imagine that the second half of 2019 could be kinder to multi-asset investors than the first half. 1H2019 was the best first half to a year for the S&P since 1997. At the same time, the iShares Core U.S. Aggregate Bond ETF had what looks like its best half on record. In a true testament to just how over-the-top the bond rally was, the German 30-year bond logged a total return of some 15%. That would be the second-best 6-month return in a quarter century and very nearly better than the S&P's first-half gain.
I concede that Nintai’s investment philosophy doesn’t excel in this type of market conditions. Our focus on companies with no debt, high returns on capital, deep competitive moats trading at a discount from our estimated intrinsic value go from being rare to non-existent. By the height of a cycle we might be as high as 30-35% in cash as a total percent of AUM. Nintai’s type of investment has also been penalized over the past 6 months. The rate of returns and the assets that have been achieving such outstanding results are outside our value-based thinking. Frankly, we have a hard time understanding markets like the ones we are seeing today. However, that doesn’t make it any easier for you or me. I’m not a big fan of losing and underperformance eats at me every night. I am as competitive as the next man, and it drives me harder to figure out a solution for the last 6 months’ underperformance.
The one thing Nintai will not do is panic and suddenly start purchasing block chain companies or Chinese pharmaceuticals. We are comfortable with our process over the long-term and don’t think the current market conditions can continue forever. In the final analysis, we’d rather not make as much in this type of market than to permanently impair our investment partners’ capital in a down market.
We’ve been particularly disappointed with portfolio returns since Q42018. I’ve been most surprised by the fact that even when holding 20% in cash, the portfolio had drawdowns that match (and sometimes even exceed) the general markets. This type of performance tells us that our portfolio picks are underperforming but losses have been somewhat offset by a significant cash position. Over the past six months, the companies with the largest losses have no debt, high returns on capital and equity, and great free cash flow margins. Some of the disappointment has been environmental in nature (such as a holding’s double whammy of a potential China trade war and the threat of Mexican tariffs), but overall most have been large drops in stock prices matching more general market trading. This can mean one of two things - either we mispriced the valuation/risk of the holding or the markets are mispricing the valuation/risk related to the holding. We are spending an enormous amount of time trying to better understand who is wrong in their judgment.
We are clearly not pleased with our returns YTD. As mentioned previously, since January 2019, our portfolios have held roughly 15 - 20% in cash as a percent of total assets under management. This cash position has been both a drag during up markets (bad) and acted as a sheet anchor during down markets (good). The last two quarters have been extremely disappointing with the portfolio equities underperforming the general markets by a considerable amount. That type of performance – though short-term in nature – is a huge disappointment for this firm.
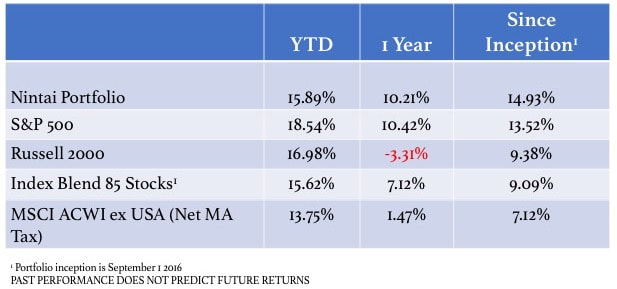
If there is a silver lining in this type of underperformance, it is that it has created a value gap between the general markets and our client portfolios. As of June 30 2019 Morningstar has the total stock market valued at a 1% premium. Our average Nintai portfolio was valued at an estimated 9% - 11% discount to the S&P 500 as of June 30 2019. Total returns (less fees) year-to-date (2019), 1 year (July 1 2018 - June 30 2019) and since inception (September 2016) are seen below:
One of things that I find particularly egregious is when investment managers cherry pick data or their respective benchmark to improve their (perceived) performance. Some try by comparing their large-cap US growth fund performance to the MSCI ACWI Index. Others might try to use a balanced fund benchmark to measure against their small-cap growth fund. Recently Neuberger Berman published an article called “The Overlooked Persistence of Active Outperformance”[1] where they argue returns would be much better if you simply removed the lowest quarter of (under)performing funds (You can almost hear them sitting around their conference room saying “everyone deserves a mulligan”). I’d like to think how well Nintai has done if I could simply take back those nasty picks that represent the lowest 25% performers in the portfolio. With arguments like this, who needs attacks from index investor supporters?
I’ve struggled at Nintai ever since we began as investment managers trying to find the best comparison to measure our performance. With an all-cap, all markets mandate, Nintai’s
portfolios tend not to be a perfect fit with the S&P 500 or a US-only index. For instance, our median portfolio holding market cap is 8% the size of the median S&P500 company. Roughly 20-25% of our holdings are non-US based companies. We also are very focused by industry – holding companies in only 5 of the 11 S&P industry categories.
In light of this, we try to give our investors a wide set of benchmarks for use in comparing Nintai performance. I start with the S&P 500 simply because this is de facto benchmark nearly every manager is compared against. I also include the Russell 2000 since this is the closest match by market cap. (The Russell 2000 median market cap is $900M versus the average Nintai portfolio’s median market cap of $721M). Fidelity also allows me to create an 80% - 85% equities and 15-20% cash benchmark. I include this because the Nintai portfolio usually holds 15 -20% of AUM in cash. (as of the end of Q2 2019 the average Nintai cash position was 26% of total AUM). Finally I include the MSCI ACWI ex-US index because of the substantial holdings in international stocks (as of the end of Q2 2019, the average Nintai portfolio had roughly 24% of AUM in international stocks).
Nintai’s portfolios have generally outperformed the S&P 500 after fees. They have performed better against the other benchmarks. Which benchmark investors choose to use in measuring Nintai’s performance is entirely up to them. I think the best approach is to review performance against all and see – in totality – how the portfolio has performed. I haven’t found a reasonable way to create a summary of all the benchmarks and generate an average rate of return. Until we do, we will continue to provide investors with a relatively large portfolio/benchmark return chart.
One thing I can assure you. Whether our returns outperform or underperform the markets, Nintai will report results in a direct and forthright manner. We look to give investors information on their returns in the manner we’d like to have given to us. If our performance lags, you will hear about it.
Winners and Losers
Two stocks led the way in Q2 – Veeva Systems (VEEV) and Manhattan Associates (MANH). Veeva was up 27% in the quarter while Manhattan increased by 23%. Veeva’s May quarterly earnings exceeded both top and bottom lines. Management upped guidance (again) as well. Over the last year, VEEV has increased free cash flow by 37%, EPS by 71%, and revenue by 28%. We increased Veeva’s estimated intrinsic value by roughly 13% in February 2019 after the company raised guidance. We increased it by an additional 16% in May. The position gained roughly 185% since I purchased it in February 2018. ***Note: We eliminated the position entirely in early July 2019 based on valuation ***
Manhattan Associates continues its run as the acknowledged leader in warehouse management systems (WMS). In Q2 the company received the leadership award in Gartner’s WMS magic quadrant for the 11th consecutive year. In addition, Dennis Story was named CFO of the year. The company has ramped up R&D by nearly 40% to begin its push into AI-driven fulfillment workflow capabilities. While pushing down free cash margins from the mid-20s to low-20s, these efforts will likely prove to be the growth drivers over the next 10 – 20 years. Return on equity has jumped from 26% on 2012 to 73% in 2019. Return on invested capital has also jumped from 68% in 2012 to 247% in 2019. Shares outstanding has dropped from 124M in 2004 to 65M in 2019. Free cash flow margins remain in the low-20% range. The company has no debt and roughly $100M cash on the balance sheet.
Our biggest loser by far was PetMed Express (PETS). Nothing is as frustrating as spending 3 – 4 months completing intense research on a company, make a decision to add it to the portfolio, and then promptly see the share price drop by 35%. As a positive spin to all this, it gave us the opportunity to keep loading up on the stock as it continued to drop.
The markets seem to be spooked by the IPO of Chewy (the markets valued the company at $9B versus PETS market cap of $312M). There is of course the talk of Amazon driving out all competition, but it should be noted that PetMed Express is a licensed pharmacy in all 50 states, dispensing FDA approved medications not just OTC products. This requires registration with both State Boards of Pharmacy as well as federal registration required for Schedule V medication fulfillment. While growth slowed in 2019, I haven’t seen anything after talking to management, customers, veterinarians, and state Board members that suggests the business model is broken or impaired in any way.
Portfolio Characteristics
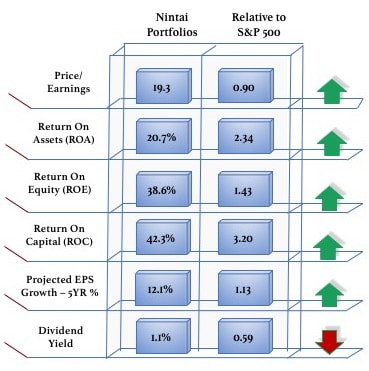
The current Abacus view as of June 30 2019 shows that the Nintai Portfolio holdings are roughly 10% cheaper than the S&P500 and projected to grow earnings at a substantially greater rate than the S&P500 over the next five years. Combining these two gives us an Abacus Comparative Value (ACV) of +23. The ACV is a simple tool which tells us how the portfolio stacks up against the S&P 500 from both a valuation and an estimated earnings growth stand point. We like to see the portfolio below the valuation of the S&P 500 but with a higher 5 year estimated earnings growth rate. Like an increasingly compressed spring, these two numbers – combined with higher rates of return on equity and capital – should lead to long-term outperformance. An ACV of >15 has led to outperformance over 90% of the last twenty 5 year rolling periods.
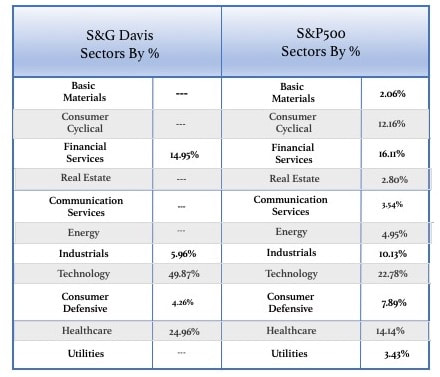
We remain highly focused in industry and sector weightings. We currently have holdings in only 5 of the S&P500’s 11 categories - financial services, technology, industrials, consumer defensive, and healthcare. Industrials and consumer defensive are both extremely small holdings with roughly 90% of holdings in just three categories – financial services, technology, and healthcare. However, I should point out we see the categorization of the portfolio slightly differently. For instance, Computer Modelling Group is categorized as a technology company by the index. However, with 100% of its revenue derived in the oil and gas discovery process, I consider the company a way to gain exposure in the energy industry.
Turnover for the quarter was roughly 13%. I expect this to drop as assets under management increase. I try to look for turnover of roughly 5-10% annually. This is dependent of course on factors such as overall market performance (steady increases over the past few years have forced us to take profits thereby increasing turnover) or individual stock performance (a sudden price drop of 20% might make for a compelling buy scenario). I have reached the upper end of stocks I look to own in the portfolio. It’s likely that most trading going forward will be additions or subtractions from existing positions. Occasionally opportunities may arise where I swap out an entire position for one that is either trading at a steeper discount to my intrinsic value and represents a step up in quality and potential long-term gains.
Cash as a percent of assets under management remains high at roughly 25%. This number is a reflection of the lack of opportunities to invest in the current markets. It is also a statement on the valuations of current holdings (meaning that individual portfolio holding valuations are at record highs) which forces us to take profits and reduce our holdings’ size.
A Note on the Markets
If markets continue to push onwards to new highs it is likely this number will go higher. Gurufocus does a great job of providing investors with Warren Buffett’s market valuation indicator. Buffett said the ratio between the Wilshire 5000 to the US gross domestic is “probably the best single measure of where valuations stand at any given moment.” As of June 30 2019 the ratio stands at approximately 1.44. Utilizing Mr. Buffett’s calculation, the ratio implies an annual return of -2.1% over the next decade. Additionally, Jack Bogle’s market return formula (dividend yield + earnings growth + speculative return) isn’t looking to knock it out of the park either. Current dividend yields are roughly 1.8%. I project earnings growth to be roughly 2 - 3% annually over the next decade. Let’s split that and say 2.5%. So far that gets us an investment return of 4.3% (1.8% + 2.5%). I’m assuming the speculative return (defined as the growth or shrinkage of the P/E ratio) will drive the P/E ratio closer to its long-term average of roughly 15. It currently stands at roughly 22. To regress to the median, the speculative return would be rough -4% annually over the next decade. This would give us a decade of roughly flat returns.
Both of these calculations would suggest there is considerable risk in the equity markets at these prices. It is for this reason I have been taking profits – or eliminating entire positions – to protect against the downside. Until prices come down (or earnings show far greater growth estimates), then cash represents a safe holding to prevent a permanent impairment of your capital.
As Nintai Investments LLC, I take my responsibility seriously to wisely allocate capital, prudently manage risk, and attempt to generate adequate returns. Helping individuals and organizations achieve their life goals, support their corporate giving, or meet their retirement needs is a remarkable honor and mark of great trust. Every day we look to continue earning tour investment partners’ trust. Should you have any questions, please do not hesitate to contact me by phone or email.
Thomas Macpherson
[email protected]
603.512.5358
My best wishes for a wonderful summer season.


 RSS Feed