“When you look at the data, they show that funds that trade less, charge less, and keep things the simplest, nearly always outperform those with more trading, higher costs, and increased complexity. This isn’t rocket science.”
- Nintai Partners, "Investing in the KISS Method”
Over the years, I’ve written several times about how complexity plays a role in investor performance, generally in a negative way. This is for two reasons. First, complexity typically means higher costs because of increased trading or transactional costs. Second, complex investment strategies generally need more things to go right, which inverted means many things can go wrong. In most cases, the latter is more accurate than the former.
Even with such a poor record, complexity continues to drive growth on Wall Street. A classic example has been the growth of thematic funds, where a mutual fund company creates a fund based on any industry or societal trend where investors think above-average growth and profits will take place over the next few years. These trends or themes include everything from an obesity-focused fund to an ADHD-centered fund or model train focus (I’m not kidding. These are real thematic funds). Unfortunately, these funds have two things going against them - one I’m focused on today (complexity) and the other which haunts all trendy sales - they are great until they aren’t.
Complexity: This Ain’t Your Father’s Fund Marketplace
Before I get into the results of Morningstar’s review of thematic funds, I want to touch on the more general idea of complexity in mutual funds. The industry has created a huge range of products that boggle the mind. Funds have been created in almost any shape or form, ranging from index-based to actively managed, single-leveraged to triple-leveraged, from a passive ultra-short S&P 500 index to an actively managed Genetic Biotech High Growth fund. Morningstar reports[1] that just in the US-based fund database, there are more than 28,000 share classes from more than 800 fund companies and 128 unique fund types. And that’s just the United States markets!
On top of that, fund complexity continues to grow more diverse and far richer in its scope. From the same Morningstar report, they report that fund companies rolled out at least 139 funds focusing on options trading, 53 leveraged equity, 39 digital assets (aka cryptocurrency), 26 trading—inverse equity, 274 sector, and 205 thematic funds.
Thematic Funds: Chicken, Egg, or Cooked Goose?
As we can see from the numbers, Wall Street has continued its normal pattern of creating and marketing funds that are good for fund companies rather than for investors. The growth of thematic funds remains remarkable. Again, according to Morningstar, as of the end of December 2022, there were 2,072 surviving funds in Morningstar’s global database that fit their thematic definition. From 2019 through 2021, assets in these funds grew nearly threefold to $806 billion from $255 billion worldwide. The good news (unless you are a fund company selling such funds) is that, much like the overall markets, assets under management in thematic funds crashed in early 2022. Assets went from $241B in April 2021 to $59B by April 2022, a decline of 76%.
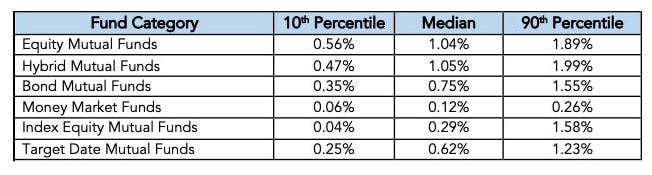
The question is, how has performance been over the long term? As with any financial instrument that combines esoteric strategy with a high turnover model, the short answer is not good. Over ten years from 2011 through 2021, annualized total returns for thematic funds was 9.75% versus a 13.86% return for the Morningstar US Market Index. Fees cause part of this disparity. The average thematic fund charges a 1.04% management fee versus the stock index funds of 0.09%. The other is the simple inability of fund managers to predict the direction of market themes accurately. Just ask anybody who has bet on the theme of crypto-currency, and you will likely see very similar results.
Another Poor Example of Complexity: Tactical Allocation
It isn‘t just thematic funds that have taken a complex model, put increased management fees in place, and allowed investors to underperform for years. Another example of this is tactical allocation funds. In another Morningstar article[2], Jeffrey Ptak discusses the absolutely dreadful returns of tactical allocation funds. He goes on to show that these fund managers never traded again after their initial “tactical”
allocation, they would have doubled their returns. Let me repeat that: they would have doubled their returns by simply setting their allocation and then gone on vacation for the next decade. The cause for this? Two things: high costs and bad “tactical” allocations.
Conclusions
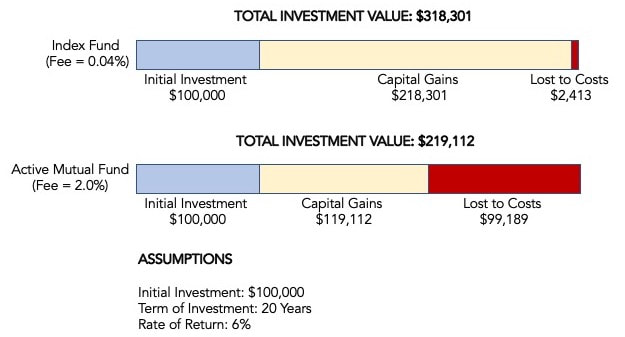
No matter how hard Wall Street flogs their increasingly complex (and expensive) fund products, they have an extremely difficult time beating the cheaper, and far simpler, passive index funds offered by Vanguard and other investment houses. The recommendations for the average individual investor remain the same – find an all-stock or all-bond index fund and add to it every month for your entire working life. In general, adding complexity isn’t going to add additional returns over the long term. In fact, the opposite is far more likely to be the case. Finding an investment house that talks about “innovative synergistic strategies,” “not for the complacent investor,” or, worst of all, “cutting-edge thematics,” generally is warning enough to close your wallet and walk away as quickly as possible. Complexity means more expensive, and more expensive means more money for the house and less for the player.
In next month’s article, I will address the last of the three themes discussed in “Thoughts in Investor Performance” in March 2023. Until then, keep your eyes on costs and invest in opportunities where assets can be purchased at a significant discount to intrinsic value. As always, I look forward to your thoughts and comments.
DISCLOSURE: I/Nintai Investments have no positions in any stocks or funds mentioned, and have no plans to buy any new positions in the stocks or funds mentioned within the next 72 hours.
[1] “The Dark Side of Thematic Funds,”, Amy Arnott, Morningstar, https://www.morningstar.com/markets/dark-side-thematic-funds
[2] “They Came. They Saw. They Incinerated Half Their Funds’ Potential Returns.” Jeffrey Ptak, Morningstar, May 30, 2023. https://www.morningstar.com/portfolios/they-came-they-saw-they-incinerated-half-their-funds-potential-returns.
- Nintai Partners, "Investing in the KISS Method”
Over the years, I’ve written several times about how complexity plays a role in investor performance, generally in a negative way. This is for two reasons. First, complexity typically means higher costs because of increased trading or transactional costs. Second, complex investment strategies generally need more things to go right, which inverted means many things can go wrong. In most cases, the latter is more accurate than the former.
Even with such a poor record, complexity continues to drive growth on Wall Street. A classic example has been the growth of thematic funds, where a mutual fund company creates a fund based on any industry or societal trend where investors think above-average growth and profits will take place over the next few years. These trends or themes include everything from an obesity-focused fund to an ADHD-centered fund or model train focus (I’m not kidding. These are real thematic funds). Unfortunately, these funds have two things going against them - one I’m focused on today (complexity) and the other which haunts all trendy sales - they are great until they aren’t.
Complexity: This Ain’t Your Father’s Fund Marketplace
Before I get into the results of Morningstar’s review of thematic funds, I want to touch on the more general idea of complexity in mutual funds. The industry has created a huge range of products that boggle the mind. Funds have been created in almost any shape or form, ranging from index-based to actively managed, single-leveraged to triple-leveraged, from a passive ultra-short S&P 500 index to an actively managed Genetic Biotech High Growth fund. Morningstar reports[1] that just in the US-based fund database, there are more than 28,000 share classes from more than 800 fund companies and 128 unique fund types. And that’s just the United States markets!
On top of that, fund complexity continues to grow more diverse and far richer in its scope. From the same Morningstar report, they report that fund companies rolled out at least 139 funds focusing on options trading, 53 leveraged equity, 39 digital assets (aka cryptocurrency), 26 trading—inverse equity, 274 sector, and 205 thematic funds.
Thematic Funds: Chicken, Egg, or Cooked Goose?
As we can see from the numbers, Wall Street has continued its normal pattern of creating and marketing funds that are good for fund companies rather than for investors. The growth of thematic funds remains remarkable. Again, according to Morningstar, as of the end of December 2022, there were 2,072 surviving funds in Morningstar’s global database that fit their thematic definition. From 2019 through 2021, assets in these funds grew nearly threefold to $806 billion from $255 billion worldwide. The good news (unless you are a fund company selling such funds) is that, much like the overall markets, assets under management in thematic funds crashed in early 2022. Assets went from $241B in April 2021 to $59B by April 2022, a decline of 76%.
The question is, how has performance been over the long term? As with any financial instrument that combines esoteric strategy with a high turnover model, the short answer is not good. Over ten years from 2011 through 2021, annualized total returns for thematic funds was 9.75% versus a 13.86% return for the Morningstar US Market Index. Fees cause part of this disparity. The average thematic fund charges a 1.04% management fee versus the stock index funds of 0.09%. The other is the simple inability of fund managers to predict the direction of market themes accurately. Just ask anybody who has bet on the theme of crypto-currency, and you will likely see very similar results.
Another Poor Example of Complexity: Tactical Allocation
It isn‘t just thematic funds that have taken a complex model, put increased management fees in place, and allowed investors to underperform for years. Another example of this is tactical allocation funds. In another Morningstar article[2], Jeffrey Ptak discusses the absolutely dreadful returns of tactical allocation funds. He goes on to show that these fund managers never traded again after their initial “tactical”
allocation, they would have doubled their returns. Let me repeat that: they would have doubled their returns by simply setting their allocation and then gone on vacation for the next decade. The cause for this? Two things: high costs and bad “tactical” allocations.
Conclusions
No matter how hard Wall Street flogs their increasingly complex (and expensive) fund products, they have an extremely difficult time beating the cheaper, and far simpler, passive index funds offered by Vanguard and other investment houses. The recommendations for the average individual investor remain the same – find an all-stock or all-bond index fund and add to it every month for your entire working life. In general, adding complexity isn’t going to add additional returns over the long term. In fact, the opposite is far more likely to be the case. Finding an investment house that talks about “innovative synergistic strategies,” “not for the complacent investor,” or, worst of all, “cutting-edge thematics,” generally is warning enough to close your wallet and walk away as quickly as possible. Complexity means more expensive, and more expensive means more money for the house and less for the player.
In next month’s article, I will address the last of the three themes discussed in “Thoughts in Investor Performance” in March 2023. Until then, keep your eyes on costs and invest in opportunities where assets can be purchased at a significant discount to intrinsic value. As always, I look forward to your thoughts and comments.
DISCLOSURE: I/Nintai Investments have no positions in any stocks or funds mentioned, and have no plans to buy any new positions in the stocks or funds mentioned within the next 72 hours.
[1] “The Dark Side of Thematic Funds,”, Amy Arnott, Morningstar, https://www.morningstar.com/markets/dark-side-thematic-funds
[2] “They Came. They Saw. They Incinerated Half Their Funds’ Potential Returns.” Jeffrey Ptak, Morningstar, May 30, 2023. https://www.morningstar.com/portfolios/they-came-they-saw-they-incinerated-half-their-funds-potential-returns.
 RSS Feed