"Well, it may be all right in practice, but it will never work in theory."
- Warren Buffett
“In theory, there is no difference between practice and theory. In practice, there is.”
- Attributed by many to Yogi Berra (incorrectly!)
In this third and last part of a three-part series, I wanted to walk readers through my valuation process by analyzing a company on my watch list – Ansys (ANSS). I held this company in the Nintai Charitable Trust portfolio for roughly 7 years and sold it after its price jumped to 160% of my estimated intrinsic value in 2015. I thought it might be interesting to revisit the company again and see what results I get from my valuation process.
In Part 2 I briefly summarized the major functional components of my valuation spreadsheet. In this article, I will review Ansys in the same order they were presented. After each section I summarize the data as either a positive or negative finding. Generally, any company that receives 25% or more negative findings I put aside as either not representative of the type of company I’m looking to invest in or simply a great company that is currently overvalued and should be placed on the watch list.
Rate of Return
Companies like high flying Ansys can surprise me at any time. This is one of those times. I look for companies that achieve 20% or greater in rates of return on both equity and price/earnings. Because of ANSS’ low return on equity and high price to earnings, the rate of return (by equity) is a rather pedestrian 15.5%. The rate of return by earnings is far worse – an extraordinarily low 3.3%. This number is impacted by Ansys’ low 10-year earnings CAGR of 7.6%. All in all, the company clearly generates numbers too low for my interest.
FINDING: NEGATIVE
Allocation of Capital
As mentioned in Part 2, return on allocated capital tells you more about the management than return on invested capital (see below). I like to see a management team that has put up 10 years of 15%+ return on allocated capital. Ansys’ ROAC is roughly 4% over the past 10 years. Much like its cash return, ANSS’ management has done a poor job using its retained earnings to grow the business. With numbers like this, it’s more likely than not the company will have a difficult time compounding value over the long-term.
FINDING: NEGATIVE
Balance Sheet Strength
Ansys has a pristine balance sheet with $930M in cash or short-term investments on the balance sheet. They have no short or long-term debt. The company has grown cash as a percent of liabilities from 68% in 2011 to 166% in 2017. Cash represents 33% of total assets. However, a number that really jumps out on the balance sheet is $1.3B in goodwill. For a company with poor allocation of capital, this is a significant factor – paying far too much for acquisitions. Any write down of this goodwill could be like a grenade ready to go off with a dramatic impact on the share price. Remember: focus on the downside first.
FINDING: NEGATIVE
Free Cash Flow Yield
In the cases of earnings yield and free cash flow yield, Ansys has outstanding rates 52% and 36% respectively. Compared to a 10-year Treasury yield of 2.5%, the company’s yield measures are very positive. I look for rates at 15 – 20% or higher. These numbers certainly make the cut.
FINDING: POSITIVE
Return on Invested Capital
Return on invested capital tells you a lot about the business structure and operations while return on allocated capital tells you more about management. For return on invested capital, at first glance it looks like the company generates high returns – 84% in 2017. But not so fast! With goodwill making up roughly 50% of total assets, this number is inflated significantly. Backing out the goodwill gives me a return on invested capital of 14%. Quite a drop from 84% and below my target of 15%.
FINDING: NEGATIVE
Cash Return
The great thing about putting raw (and objective) data into my valuation model is the surprises it sometimes turns out. An example of this is Ansys’ cash return rate of 3.0%. One would expect a company like Ansys to produce a much higher rate, but the cold hard facts show that Ansys’ management simply isn’t great at utilizing the company’s assets to produce free cash. Combined with Ansys’ return on allocated capital, management has a poor record as capital allocators.
FINDING: NEGATIVE
IRR Treasury Review (or Buffett’s “Equity Bond”)
Much like other value measures, Ansys shows as highly overvalued. The price to match or beat the return of a 10-year Treasury comes in a $127/share. As of February16 2018 the stock trades at $164/share. ANSS’ stock price would need to drop $37/share or 27% from its current price to be of interest. Numbers like this demonstrate the equity risk premium far exceeds the potential reward.
FINDING: NEGATIVE
Discounted Free Cash Flow (Intrinsic Value)
Utilizing my DCF spreadsheet and using as much data from other areas to be as objective as possible, I used the following inputs.
Projected Growth in Free Cash Flow
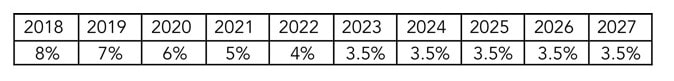
For these numbers, I used ANSS’ ten-year historical free cash flow growth rate for 2018 and reduced it steadily until it reached only 25% of the ten-year average by 2027.
Perpetuity Growth Rate: 3%
Discount Rate: 9.6% (ANSS’ five year weighted average cost of capital is 8.1%)
Utilizing these numbers Ansys is roughly 105% overvalued. To get to its current share price the company would need to generate roughly 16% free cash flow growth for the next 10 years. With a ten-year average of 13.5%, I have considerable doubts this type of growth will be possible. In this case, the current price has an inadequate (and that’s putting it mildly) margin of safety.
FINDING: NEGATIVE
Conclusions
My process to come up with valuation isn’t perfect. But over time I’ve found that it gets me close enough to decide if additional research is required. In the case of Ansys, it’s pretty clear no additional time for in-depth research is necessary. Having failed 7 of 8 core measures, I’m not even sure ANSS will stay on my watch list. Having been in the Nintai portfolio previously, this process has provided me a great counter weight to any anchoring I might have on a previous golden child of the portfolio.
Utilizing this process is a helpful step in answering the questions I wrote about in Part 1. It’s not perfect and I’ve certainly made errors in the past working with it. But in general, I think my valuation tools force me to collect, evaluate, and objectively utilize the results of the process as dispassionately as possible.
I hope this series has answered many of the questions sent to me over the past several months. I encourage readers to ask additional questions if I’ve missed something of interest. As usual, I look forward to your thoughts and comments.
 RSS Feed